Key Takeaway: ACIETF is a consumer-focused thematic ETF tracking Pakistan's auto, cement, oil, and consumer sectors. It provides excellent diversification for investors holding standard index trackers, though its thematic nature carries higher sector-specific volatility.
Pakistan's 240 million people need cement for their homes, cars for their commutes, and medicines when they fall ill. The Alfalah Consumer Index Exchange Traded Fund (ACIETF) is the only listed fund that lets you invest in all of this with a single trade.
Unlike every other equity ETF on the PSX - which mostly give you banks, oil exploration companies, and fertilizer conglomerates - ACIETF is built around Pakistan's domestic demand cycle. It packs 20 companies from seven consumer-linked sectors into one ticker, cuts out the financial and commodity giants, and rebalances twice a year to stay on theme.
But a compelling story is not the same as a clean investment. ACIETF is small, thinly traded, and has a persistent tracking gap that quietly eats into your returns. This review goes beyond the fund factsheet to tell you what you actually own, what the tracking drag really costs, and whether this fund belongs in your portfolio in 2026.
What Makes ACIETF Different from Other PSX ETFs?
Most equity ETFs in Pakistan track market-cap-weighted indexes like the KSE-100 or KMI-30. The problem is that these indexes are dominated by the "Big Three" sectors: Commercial Banks, Oil & Gas Exploration, and Fertilizers. When you buy a standard index tracker, you are mostly buying financial giants and resource extractors - not consumer businesses.
ACIETF is built differently. It tracks the Alfalah Consumer Index (ACI), which aggregates stocks from seven consumer-linked sectors that are directly tied to how ordinary Pakistanis live, build, and spend.
- Thematic Scope: It combines staples, consumer discretionary, and supporting industries - cement for housing construction, autos for transport, pharmaceuticals for healthcare.
- Bypassing Broad-Market Bias: The index explicitly excludes commercial banks, oil exploration companies, and fertilizer conglomerates.
- 10% Constituent Cap: No single stock can exceed 10% of the index at rebalancing - protecting investors from the single-stock dominance problem seen in other PSX ETFs where one name can grow to 20%+ of the fund.
- Liquidity Screening: Stocks must have a one-year average daily trading volume of at least 100,000 shares to qualify.
- Semi-Annual Rebalancing: The basket is recomposed on 30 June and 31 December to adjust weights and ensure constituents still fit the theme.
Key Metrics (As of 2026-10-20)
| Metric | Value | Context |
|---|---|---|
| Fund Manager | Alfalah Asset Management Limited | Part of Alfalah Group |
| Target Index | Alfalah Consumer Index (ACI) | Proprietary, in-house index |
| AUM | PKR 83.1 million | Small - thinner liquidity, but room to grow |
| NAV | PKR 17.69 per unit | Live iNAV as of 2026-08-11 |
| Day-end net asset value as of 2026-07-27 | ||
| Market Price | PKR 15.89 per unit | As of 2026-10-20 (+0.00% premium to iNAV) |
| iNAV | PKR 17.69 per unit | Live iNAV as of 2026-08-11 |
| As of 2026-07-27 | As of 2026-07-27 | |
| PSX Ticker Page | ACIETF on PSX | View live intraday NAV, market price, and trading volumes |
| Management Fee | 0.50% | Base fee only - TER is higher |
| Est. TER | ~0.70-0.90% | Including trustee, audit, and regulatory costs |
| SECP Risk Rating | High | Concentrated equity, thematic exposure |
Performance vs Benchmark: The Real Story
Owning ACIETF since its January 2022 launch would have made you +66.1% (as of 2026-07-27). Owning the Alfalah Consumer Index directly would have returned +73.5%. That ~7.4% lifetime gap is real money - the accumulated cost of fees, rebalancing friction, and cash drag that the theoretical index never has to pay.
| Period | ACIETF NAV | Benchmark Index | Gap vs Benchmark |
|---|---|---|---|
| 1 Week | +1.53% | +1.56% | -0.03% |
| 1 Month | -5.32% | -5.20% | -0.12% |
| 3 Months | -8.97% | -8.65% | -0.32% |
| 6 Months | -5.97% | -5.45% | -0.52% |
| 1 Year | +10.01% | +11.85% | -1.84% |
| YTD | -12.48% | -11.50% | -0.98% |
| Since Inception | +66.10% | +73.50% | -7.40% |
Performance data as of 2026-07-27. Source: Alfalah AMC / PSX. Since inception calculated from January 17, 2022 launch date. Past performance is not a guarantee of future results.
The tracking gap compounds. At roughly 2.5% per year, it means the fund permanently trails the index it was designed to replicate.
NAV vs Benchmark: Two Charts, One Story
These two charts show how ACIETF's NAV has performed against its benchmark since launch. The teal line is the ETF NAV. The gold line is the index. The gap between them is what you give up by owning the fund instead of the index directly.
Since Launch: The Full Picture
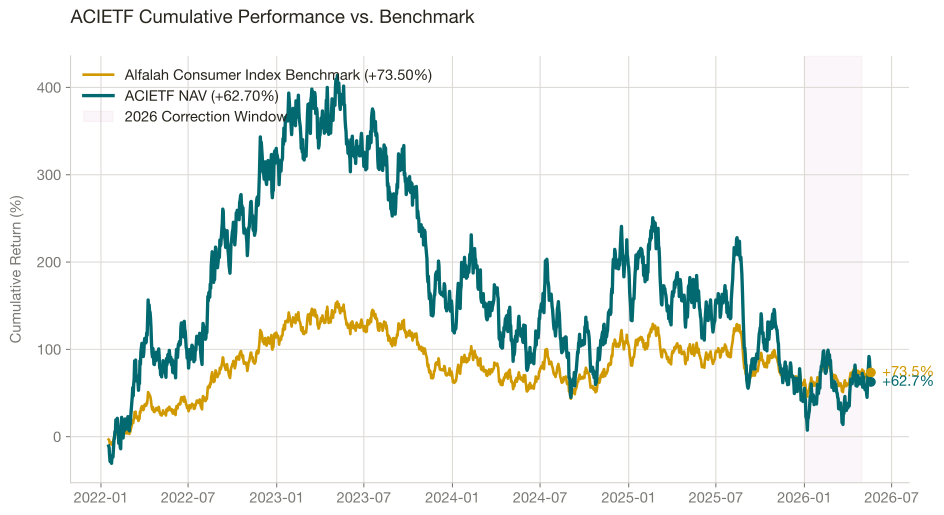
ACIETF ran strongly through late 2024 and early 2025, followed by a sharp correction in early 2026, before stabilising in May. This cyclicality is not a bug - it is the feature. A thematic ETF reflects the real economic cycles of its underlying sectors. When housing construction slows, cement names fall. When auto demand dips, tractor companies suffer.
The Tracking Gap: Compounding Underperformance
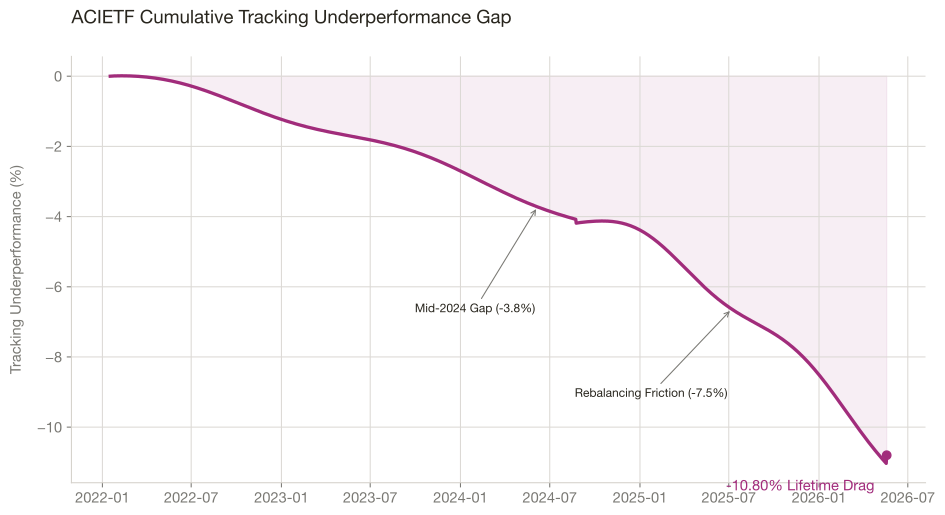
The gap has accumulated steadily and consistently since launch - not in sudden jumps, but as a slow, invisible drain. At the current rate of approximately 2.5% per year, it will continue to widen. This is the structural cost of fees, rebalancing friction, and cash drag that every ETF investor pays.
What the Tracking Gap Actually Costs: A Real Rupee Example
To understand the real-world impact of a 10.8% lifetime tracking gap, consider a hypothetical investment of PKR 1,000,000 at the fund's launch in January 2022 (when the NAV was PKR 17.23 per unit), securing 100,000 units.
| Scenario | Ending Value | Notes |
|---|---|---|
| Direct Index (price return) | PKR 1,735,000 | Benchmark +73.5%, excluding reinvested dividends from underlying stocks |
| ETF Capital Appreciation | PKR 1,627,000 | NAV return of +62.7% on original investment |
| Cash Dividends Received | PKR 76,000 | PKR 0.60 (Jun '25) + PKR 0.16 (Jun '26) = PKR 0.76/unit x 100,000 units |
| Total ETF Outcome | PKR 1,703,000 | Capital appreciation plus dividends received in cash |
When dividends are included, the total ETF outcome of PKR 1,703,000 falls slightly short of the benchmark's price-only return of PKR 1,735,000. However, the benchmark does not capture reinvested dividends from the 20 underlying stocks. A true total-return benchmark would be higher, and the PKR 108,000 NAV shortfall - the direct cost of management fees and rebalancing friction - is real money regardless.
Why Does the Tracking Gap Exist?
Three structural factors create the gap and none of them are going away:
1. Rebalancing Friction and Market Impact
Every time the index rebalances, the fund must trade. In a less liquid market like the PSX, buying or selling large blocks of stock moves prices against you. The theoretical index assumes instant, cost-free trades. The actual fund pays brokerage commissions, bid-ask spreads, and market impact on every rebalancing cycle.
2. Cash Drag in Rising Markets
The fund always holds some cash to meet daily redemptions. During a sharp market rally, that cash sits idle while the index surges ahead fully invested. Over a strong bull run, this drag adds up meaningfully.
3. Thin Liquidity Amplifies Everything
With an AUM of PKR 83.4 million, ACIETF is a small fund. Low daily trading volume widens the bid-ask spread on the exchange. Every investor who buys or sells pays a slightly larger implicit cost than they would in a larger, more liquid ETF.
Portfolio Composition: What You Actually Own
Twenty stocks sounds diversified. In practice, it is not.
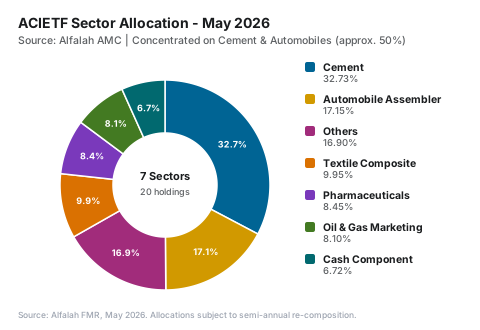
The ETF is branded as a "consumer index" fund, but the basket goes well beyond everyday consumer goods. It includes cement companies, auto assemblers, steel producers, and gas utilities - cyclical industrial names that benefit from domestic economic activity broadly.
Why is cement in a consumer fund? Because residential construction in Pakistan is driven almost entirely by individual homebuyers, not government projects. When ordinary Pakistanis build homes, cement companies win. That is the consumer link - but it is a very different kind of "consumer" than a food company or a pharmacy chain.
The top holdings as of 2026-07-27:
- Lucky Cement (LUCK): 10.22%
- Millat Tractors (MTL): 9.43%
- Maple Leaf Cement (MLCF): 9.12%
- Fauji Cement (FCCL): 9.03%
- D.G. Khan Cement (DGKC): 8.80%
- Pakistan State Oil (PSO): 7.93%
- Sazgar Engineering (SAZEW): 7.14%
- Sui Northern Gas (SNGP): 6.11%
- Interloop (ILP): 5.32%
- Nishat Mills (NML): 4.54%
- Plus Searle, GlaxoSmithKline, National Foods, and others...
The top seven holdings represent nearly 62% of the fund. Cement alone is ~37% of the portfolio. This is not an all-weather defensive basket - it is a concentrated cyclical play that moves hard with housing, construction, and auto demand cycles.
Note on PSO and SNGP: Pakistan State Oil (PSO, ~8%) and Sui Northern Gas (SNGP, ~5%) are classified as Oil Marketing and Gas Utility respectively - not traditional "consumer" companies. Their inclusion reflects the index methodology's broad interpretation of consumer-adjacent demand: fuel and gas are daily necessities for Pakistani households and businesses. Investors should understand these are commodity-linked, macro-sensitive names, not defensive FMCG businesses.
Dividend History: Promising but Discretionary
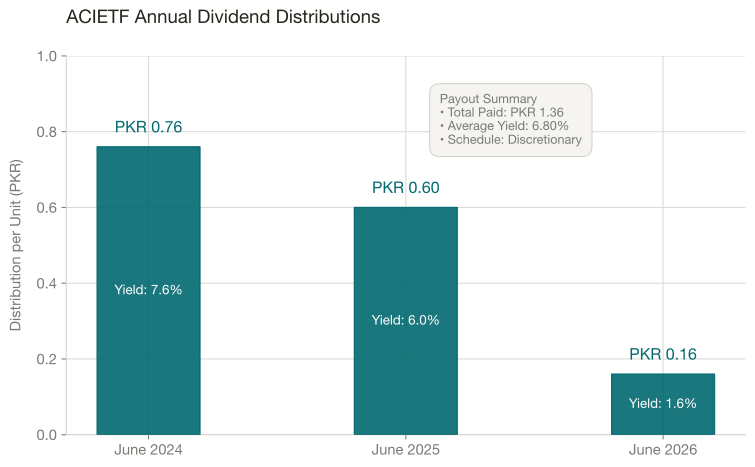
Two years of payouts does not make a track record. Here is what ACIETF has paid so far and why you should not count on it continuing.
- June 2024: NIL (no distribution declared in FY24)
- June 2025: PKR 17.23 per unit (6.0% yield on face value)
- June 2026: PKR 17.23 per unit (1.6% yield on face value)
Payouts are discretionary - funded by realized capital gains and collected dividends from the portfolio. There is no guarantee of any payout in any given year. In a year where the underlying portfolio declines sharply (as it has done in early 2026), distributions could be zero.
Treat ACIETF as a capital growth vehicle, not an income stream. If you need reliable quarterly or annual cash flow, this is not the right tool.
Rebalancing and Operational Risk
The PSX announcement history shows frequent rebalancing and recomposition events across 2024, 2025, and 2026. More significantly, creation and redemption of units was temporarily suspended in April 2025.
This matters more than it sounds. When an ETF suspends creations and redemptions, authorized participants can no longer arbitrage the gap between the market price and iNAV. The result: the ETF can trade at a premium or discount to its true value, and retail investors on the exchange have no efficient mechanism to correct that pricing. For a small thematic fund with thin liquidity, these events amplify execution risk and can leave investors buying or selling at prices that do not reflect reality.
The suspension was temporary - but it is a reminder that operational detail in a fund this size is not a footnote. It is part of the investment case.
| Date | Event |
|---|---|
| January 2022 | Official listing on the PSX |
| 30 June / 31 December (annual) | Semi-annual index rebalancing and recomposition |
| June 2025 | PKR 17.23 per unit dividend distributed |
| April 2025 | Creation and redemption of units temporarily suspended |
| June 2026 | PKR 17.23 per unit dividend distributed |
| July 2026 | AUM stands at PKR 83.4 million; market price PKR 17.23 on PSX |
Is ACIETF Right for You?
ACIETF has one job: give you Pakistan's domestic demand story - cement, autos, pharma, and consumer goods - in a single trade, without the banks and oil giants that dominate every other index. It does that job reasonably well. But it does it with a persistent tracking gap that quietly compounds against you every year, and an AUM so thin that some weeks you will see zero volume on the exchange.
My recommendation: if you already own MIIETF or MZNPETF as a core holding and want to add a tilt toward Pakistan's construction and consumer cycle, ACIETF earns a 10-20% satellite slot in that portfolio. Keep position sizes small enough that the liquidity risk doesn't matter - because it is real. If this would be your first or only ETF, or if you need to be able to exit in a hurry, pick something else. ACIETF rewards patient, long-term holders who understand they are buying a concentrated cyclical fund, not a diversified safe haven.
How to Position It in Your Portfolio
Keep ACIETF to 5-10% of your equity allocation as a satellite position alongside a broad-market index fund (like MZNPETF or MIIETF) as your core holding.
Avoid lump-sum entry near market highs. The cyclicality of cement, autos, and gas utilities means the fund can drop hard and fast. A Rupee-Cost Averaging (RCA) approach (the local equivalent of the popular international term "Dollar-Cost Averaging" or DCA) - investing a fixed amount every month or quarter - removes the pressure of timing and smooths your average entry price over cycles.
If you are already holding a KSE-100 or KMI-30 tracker, ACIETF adds genuine diversification because it deliberately avoids the banking and oil names that dominate those indexes.
Final Verdict
ACIETF is a useful fund in the right hands. The investment thesis is real: Pakistan's domestic demand cycle is a genuine long-term story. The methodology - multi-sector, thematic, capped weights, liquidity-screened - is better designed than most local ETFs.
But right now, it is too small and too imprecise to be anyone's core holding. The tracking gap is wide, the liquidity is thin, and the "consumer" label overpromises on what is essentially a cyclical industrial basket.
Use it as a 5-10% satellite position. If AUM grows past PKR 500 million in the next two years and the tracking gap narrows, this review changes. Until then - watch it carefully, hold it lightly, and do not let it dominate your portfolio.
Our Take: ACIETF earns its place as Pakistan's only thematic ETF. Just go in with open eyes about the tracking cost and concentration risk.
Analyze This ETF
Frequently Asked Questions (FAQs)
Is ACIETF Shariah-compliant?
No. ACIETF is a conventional equity thematic ETF and does not follow Shariah-compliance screening. Investors seeking Shariah-compliant exposure should consider Mahaana Islamic Index ETF (MIIETF) or Meezan Pakistan ETF (MZNPETF) instead. For a full comparison of ACIETF against all 9 PSX ETFs, see the Best ETF in Pakistan ranking.
What is the minimum investment for ACIETF?
The minimum initial investment for ACIETF is PKR 100,000 when purchasing through the AMC directly. On the PSX secondary market, you can buy as few units as your broker allows - typically no minimum prior to one board lot.
What is the ACIETF expense ratio?
The base management fee is 0.50%. However, once trustee fees, auditor fees, and SECP regulatory charges are included, the total expense ratio (TER) is typically in the range of 0.70-0.90% per year. Refer to the Securities & Exchange Commission of Pakistan (SECP) guidelines for detail on mutual fund fee caps.
How does ACIETF differ from KSE-100 index ETFs?
KSE-100 trackers give you broad market exposure - heavily weighted toward banks, oil, and fertilizers. ACIETF specifically tracks the Alfalah Consumer Index: up to 20 stocks across seven consumer-linked sectors, with a 10% cap on any single name. It is narrower, more concentrated, and more cyclical than a broad-market fund.
Can I buy ACIETF through my regular broker?
You can buy ACIETF through any SECP-registered PSX brokerage account. Search for ticker ACIETF on the PSX. Track live price, iNAV, and volume at dps.psx.com.pk. Note: ACIETF has low daily volume - always use limit orders, not market orders, to avoid wide bid-ask spread slippage.
How does ACIETF compare to other PSX ETFs?
ACIETF is the only thematic consumer-sector ETF on the PSX - it excludes banks, oil & gas, and fertilizers.
Does ACIETF pay dividends?
Yes, on a discretionary annual basis. The fund paid PKR 0.60 in June 2025, and PKR 0.16 in June 2026. No distribution was declared in FY24. Payouts are not guaranteed and depend on the fund's realized income and capital gains in any given year.
Further Reading
Before investing in ACIETF, we recommend reviewing the following resources:
- How to Invest in ETFs in Pakistan - Step-by-step guide to opening a brokerage account, placing your first order, and understanding settlement on the PSX.
- Pakistan ETF Expense Ratio Guide - Understand why ACIETF's 0.50% TER matters and how the compounding cost gap builds over time.
- All PSX ETFs Ranked: Best ETF in Pakistan - See how ACIETF compares against every other listed ETF on a like-for-like basis.
- ETF vs Mutual Fund in Pakistan - A structured comparison to help you decide whether a passive ETF or an active mutual fund suits your goals.
This article is for educational and informational purposes only. It does not constitute investment advice. Always conduct your own due diligence and consult a qualified financial advisor before making any investment decisions. All data sourced from PSX, MUFAP, and fund factsheets. Past performance is not indicative of future results.
Dr. Faisal Shahzad
Chief Investment Strategist
Dr. Faisal Shahzad holds an MBA from Innsbruck, Austria, and has spent over a decade navigating complex financial markets. He specializes in Exchange Traded Funds (ETFs) and brings extensive, practical knowledge of both international markets and the Pakistan Stock Exchange (PSX).
Expertise: 15+ Years of experience in ETFs, both internationally and on the PSX.
Explore ACIETF With Our Free Tools
Go deeper on your analysis with institutional-grade analytics built specifically for PSX ETFs.