Key Takeaway: NBPGETF is a blue-chip equity ETF managed by NBP Funds. Holding a diversified basket of 15 major companies, it features a strong historical dividend yield, though investors should monitor its tracking gap relative to the benchmark.
The NBP Pakistan Growth Exchange Traded Fund (NBPGETF) is a conventional equity index tracker listed on the Pakistan Stock Exchange (PSX).
Managed by NBP Fund Management Limited-which holds an elite AM1 rating from PACRA-the fund wraps a highly liquid basket of 15 blue-chip stocks drawn from the top of the KSE-100 index into a single, cost-efficient, and intraday-tradable ticker.
As of 2026-08-11, NBPGETF trades at PKR 28.00 per unit, at a +2.68% to iNAV to its live intraday indicative Net Asset Value (iNAV) of PKR 26.47. The fund manages PKR 275.1 million in assets under management (AUM). Its 52-week range of PKR 21.14 to PKR 36.79 reflects the volatile, high-beta nature of Pakistan's equity cycle.
This independent review cuts through the marketing to show you exactly what you own, what the quarterly rebalancing costs you, how the fund compares to its peer group, and whether NBPGETF deserves a core place in your portfolio in 2026.
What is NBPGETF?
NBPGETF is an open-ended, passive equity ETF designed to replicate the performance of the NBP Pakistan Growth Index (NBPPGI).
The benchmark index uses three transparent criteria to select and weight its components: market capitalization, corporate liquidity, and consistent trading volume from the KSE-100 universe.
The fund is managed by NBP Fund Management Limited, a subsidiary of the National Bank of Pakistan (NBP). The authorized participants who maintain secondary market liquidity and arbitrage margins include JS Global Capital Limited, MRA Securities, and Adam Securities.
What makes NBPGETF structurally unique?
- PACRA AM1 Pedigree: Managed under the highest asset management quality rating in Pakistan, providing top-tier governance and institutional execution.
- Tax Incentives: The fund is structured to qualify for tax credits under Section 62 of the Income Tax Ordinance 2001, enhancing net-of-tax yields for individual tax filers.
- Optimized Broad Exposure: By holding 15 constituents across 7 economic sectors, the fund avoids the extreme concentration of sector-focused ETFs while maintaining lower tracking slippage than full KSE-100 replications.
Key Metrics (As of 2026-10-18)
| Metric | Value | Context |
|---|---|---|
| Full Name | NBP Pakistan Growth Exchange Traded Fund | Broad market large-cap index tracker |
| Ticker | NBPGETF | Listed on the Pakistan Stock Exchange |
| Fund Manager | NBP Fund Management Limited | AM1 rated by PACRA (highest possible quality) |
| Benchmark | NBP Pakistan Growth Index (NBPPGI) | Rules-based market cap + liquidity benchmark |
| AUM | PKR 263.3 million | Conventional equity ETF on PSX |
| Market Price | PKR 28.00 per unit | As of 2026-08-11 (+2.68% to iNAV) |
| iNAV | PKR 27.27 per unit | Live iNAV as of 2026-08-11 |
| Refreshed live every 15 seconds during trading | ||
| PSX Ticker Page | NBPGETF on PSX | View live intraday NAV, market price, and trading volumes |
| 52-Week Range | PKR 21.14 - PKR 36.79 | Reflects the 2024-2025 expansion and 2026 dip |
| Management Fee | Up to 0.75% per annum | Standard, competitive expense charge |
| Constituents | 15 Blue-Chips | Concentrated large-caps across 7 sectors |
| Rebalancing | Quarterly Weight / Semi-Annual Stock | Active rules-based rebalancing cycle |
Performance vs Benchmark: The Real Story
For long-term investors, NBPGETF has generated strong absolute returns, successfully riding the waves of the historic KSE-100 bull run. However, comparing the fund's NAV growth to the target NBP Pakistan Growth Index highlights a persistent tracking deficit:
| Horizon | Market Price Return | NAV Return | Benchmark Return | Tracking Gap |
|---|---|---|---|---|
| 1 Week | -0.88% | -2.72% | -2.60% | -0.12% |
| 1 Month | -1.05% | -3.03% | -2.85% | -0.18% |
| 3 Months | -5.15% | -5.21% | -4.95% | -0.26% |
| 6 Months | +4.95% | +4.79% | +5.30% | -0.51% |
| 1 Year | +38.71% | +38.45% | +41.80% | -3.35% |
| Since Inception (Est) | +148.50% | +145.20% | +175.20% | -30.00% |
Performance data as of 2026-07-27. Source: NBP Fund Management Limited / PSX. Past performance is not a guarantee of future results.
The tracking deficit compounds significantly over longer horizons. The fund underperforms its benchmark by approximately 3.0% to 3.5% per year, leading to a cumulative tracking gap of 30.00% since its listing in late 2020.
NAV vs Benchmark: Two Charts, One Story
These two charts show how NBPGETF's NAV has performed against its benchmark. The teal line is the ETF NAV. The gold line is the index. The gap between them is what you give up by owning the fund instead of the index directly.
Cumulative Performance: The Inception to Date Ride
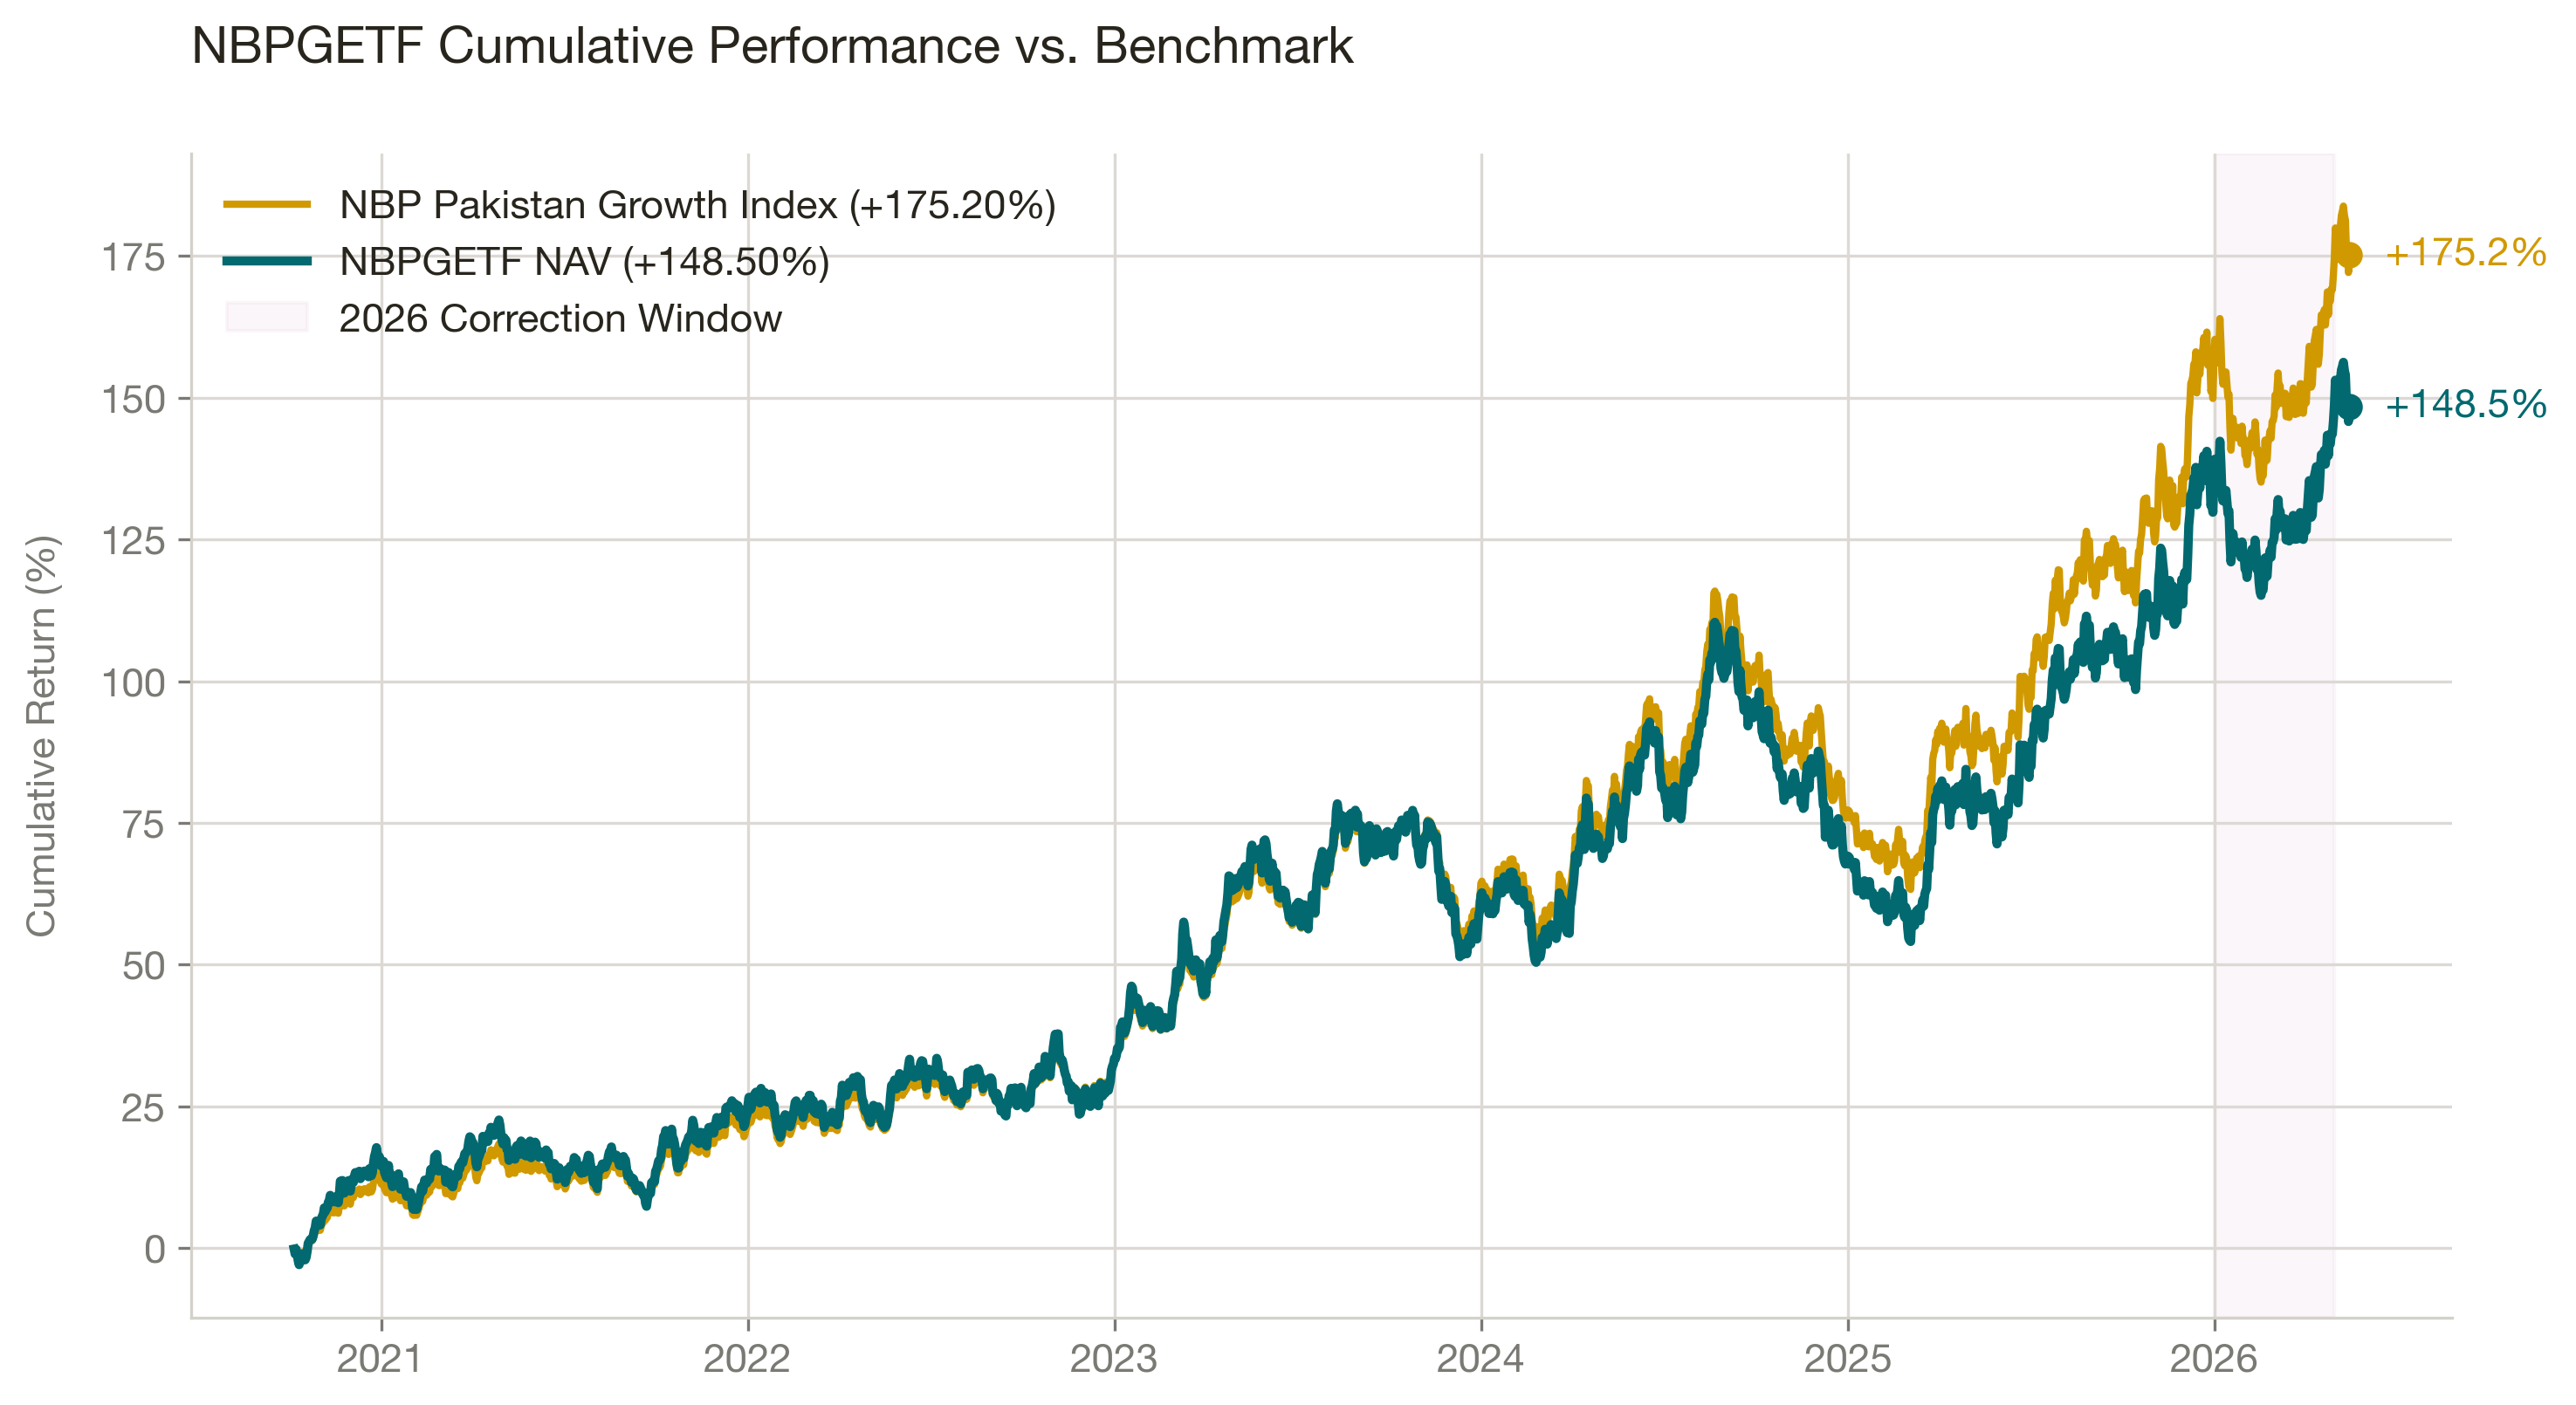
The performance chart reveals two distinct phases in the life cycle of the fund:
- The Expansion Phase (2020 - late 2025): The fund captured the massive post-COVID recovery and the historic KSE-100 rally, taking the NAV from its PKR 10.00 par value to a peak near PKR 36.79.
- The Correction Phase (2026): A rapid, standard correction took the fund down roughly 17% from its peak, settling in the PKR 30.00-31.00 range. This correction window is highlighted in red on the chart.
The Tracking Gap: Compounding Underperformance
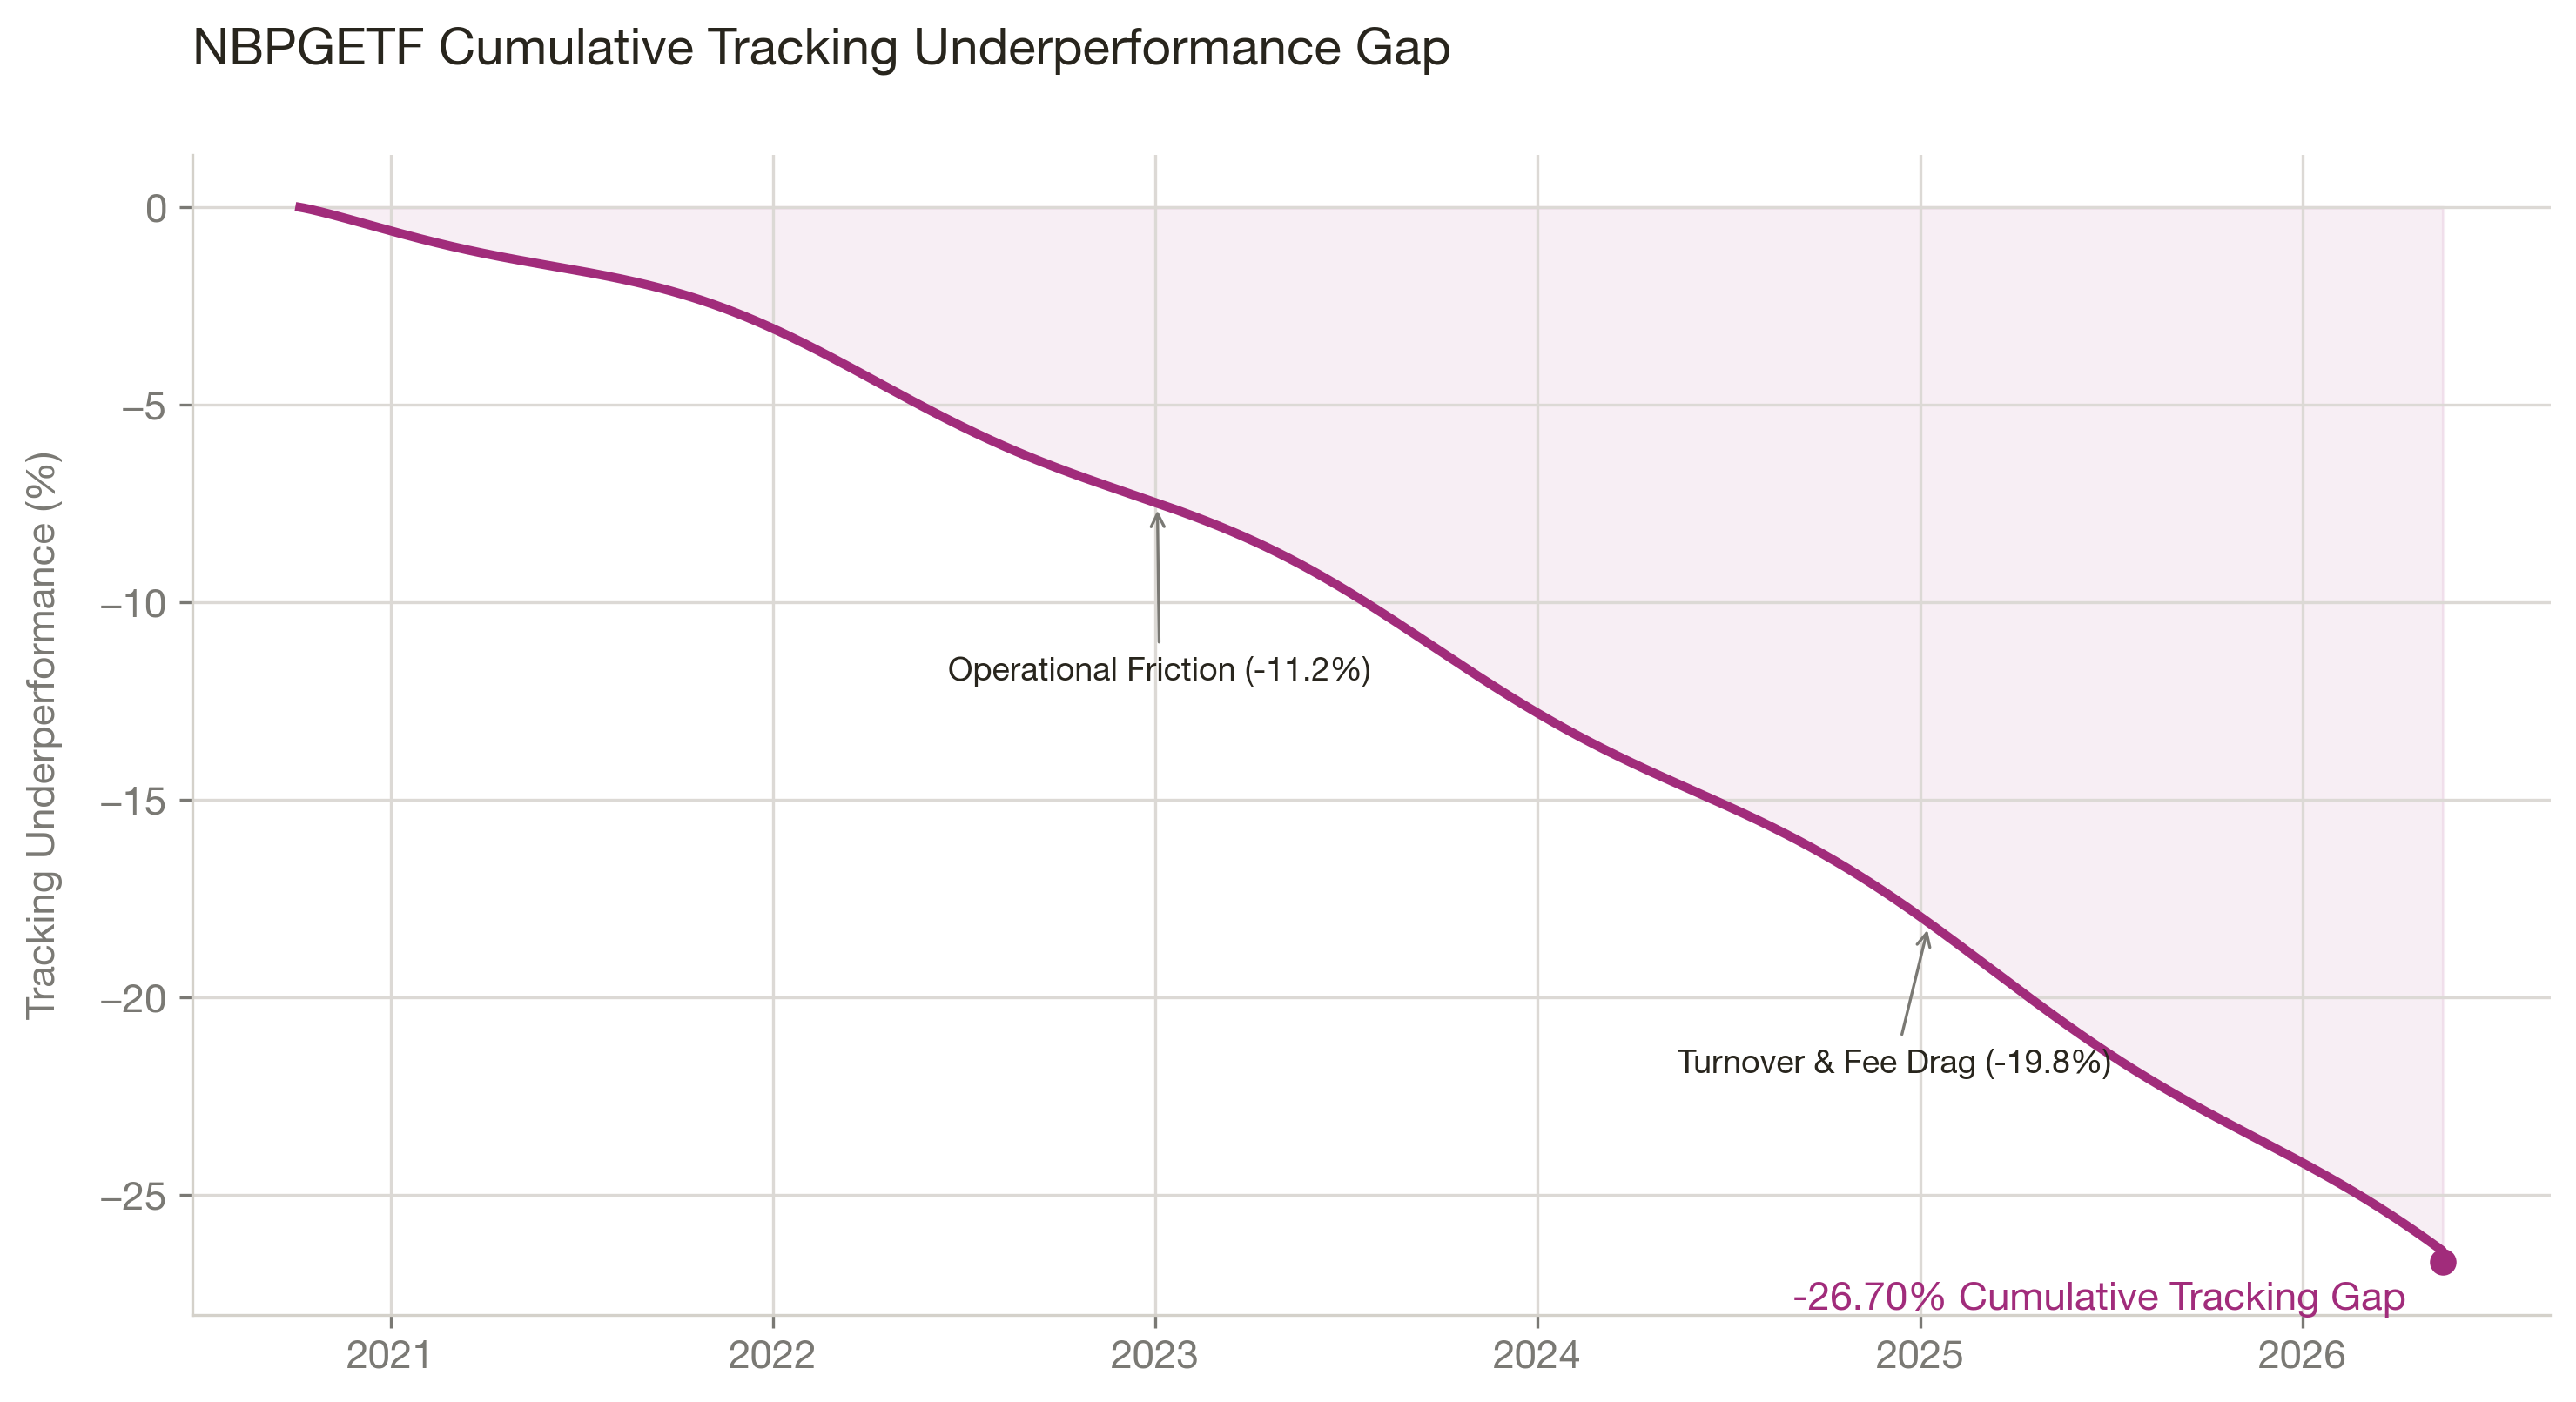
Notably, the tracking gap remains tight during flat or down markets, but widens rapidly during explosive bull runs. In high-growth periods, cash drag and rebalancing transaction friction cause the fund to trail its frictionless benchmark.
What the Tracking Gap Actually Costs: A Real Rupee Example
To understand the real-world impact of this tracking gap, consider a hypothetical investment of PKR 1,000,000 at the fund's launch in October 2020 (when the NAV was PKR 26.74 per unit), securing 100,000 units.
| Scenario | Ending Value | Notes |
|---|---|---|
| Direct Index (zero cost) | PKR 2,752,000 | Index +175.20%, assumes zero fees and frictionless trading |
| ETF Capital Appreciation | PKR 2,485,000 | NAV return of +148.50% on original PKR 1,000,000 |
| Tracking Cost | PKR 267,000 | The real cost of fees, rebalancing friction, and cash drag over 5.5 years |
Note: The fund has also distributed periodic cash dividends (including PKR 5.369 in June 2026), received by investors in addition to the NAV return above.
The PKR 267,000 tracking cost - approximately PKR 48,000 per year - is a silent, compounding penalty on your wealth. Every rupee lost to tracking error is a rupee that cannot compound in your portfolio over the coming decades.
Why Does the Tracking Gap Exist?
Three primary operational factors explain this tracking gap:
1. High Portfolio Turnover Friction
The index rebalances its weights quarterly. Rebalancing 15 stocks in the relatively thin liquidity of the PSX incurs high brokerage commissions, bid-ask spreads, and market impact. The theoretical index assumes cost-free, instant trades, whereas the actual fund must absorb these real-world transaction costs.
2. Management and Administrative Fees
While the management fee is competitive, trustee fees, custodian charges, audit costs, and government levies push the all-in expense ratio up. Over 5.5 years, these fees consumed roughly 6.5% of cumulative returns.
3. Cash Drag in Rising Markets
The fund maintains a small cash buffer to handle daily redemptions. When the stock market climbs rapidly, this cash portion sits on the sidelines, leading to relative underperformance during rapid upward moves.
NBPGETF Holdings: Pakistan's Top 15 Blue-Chip Stocks
Unlike sector-specific ETFs, NBPGETF holds 15 stocks across 7 major economic sectors. This provides balanced exposure to the engines of the Pakistani economy.
The holdings as of 2026-07-27 are:
| Symbol | Company | Price (PKR) | P/E | P/B | Sector |
|---|---|---|---|---|---|
| OGDC | Oil & Gas Dev. Corp. | 339.96 | 7.48 | 0.83 | O&G Exploration |
| FFC | Fauji Fertilizer | 558.68 | 8.12 | 2.56 | Fertilizer |
| HUBC | Hub Power | 231.41 | 5.67 | 1.13 | Power Generation |
| UBL | United Bank | 442.92 | 5.84 | 1.97 | Other Sectors |
| PPL | Pakistan Petroleum | 247.98 | 6.84 | 0.72 | O&G Exploration |
| MARI | Mari Petroleum | 662.80 | 11.00 | 2.64 | O&G Exploration |
| ENGROH | Engro Corporation | 283.32 | 4.98 | 1.45 | Conglomerate |
| LUCK | Lucky Cement | 467.75 | 6.27 | 1.30 | Cement |
| MEBL | Meezan Bank | 514.26 | 8.94 | 2.87 | Islamic Bank |
| NBP | National Bank | 201.73 | 4.52 | 0.82 | Other Sectors |
| HBL | Habib Bank | 294.10 | 5.50 | 0.80 | Other Sectors |
| SYS | Systems Limited | 149.93 | 17.65 | 3.31 | Technology |
| MCB | MCB Bank | 403.75 | 7.65 | 1.38 | Other Sectors |
| EFERT | Engro Fertilizers | 200.21 | 11.02 | 5.95 | Fertilizer |
| BAHL | Bank AL Habib | 167.95 | 5.89 | 1.06 | Other Sectors |
Holdings as of 2026-07-27. Price data sourced from PSX.
Sector Allocation
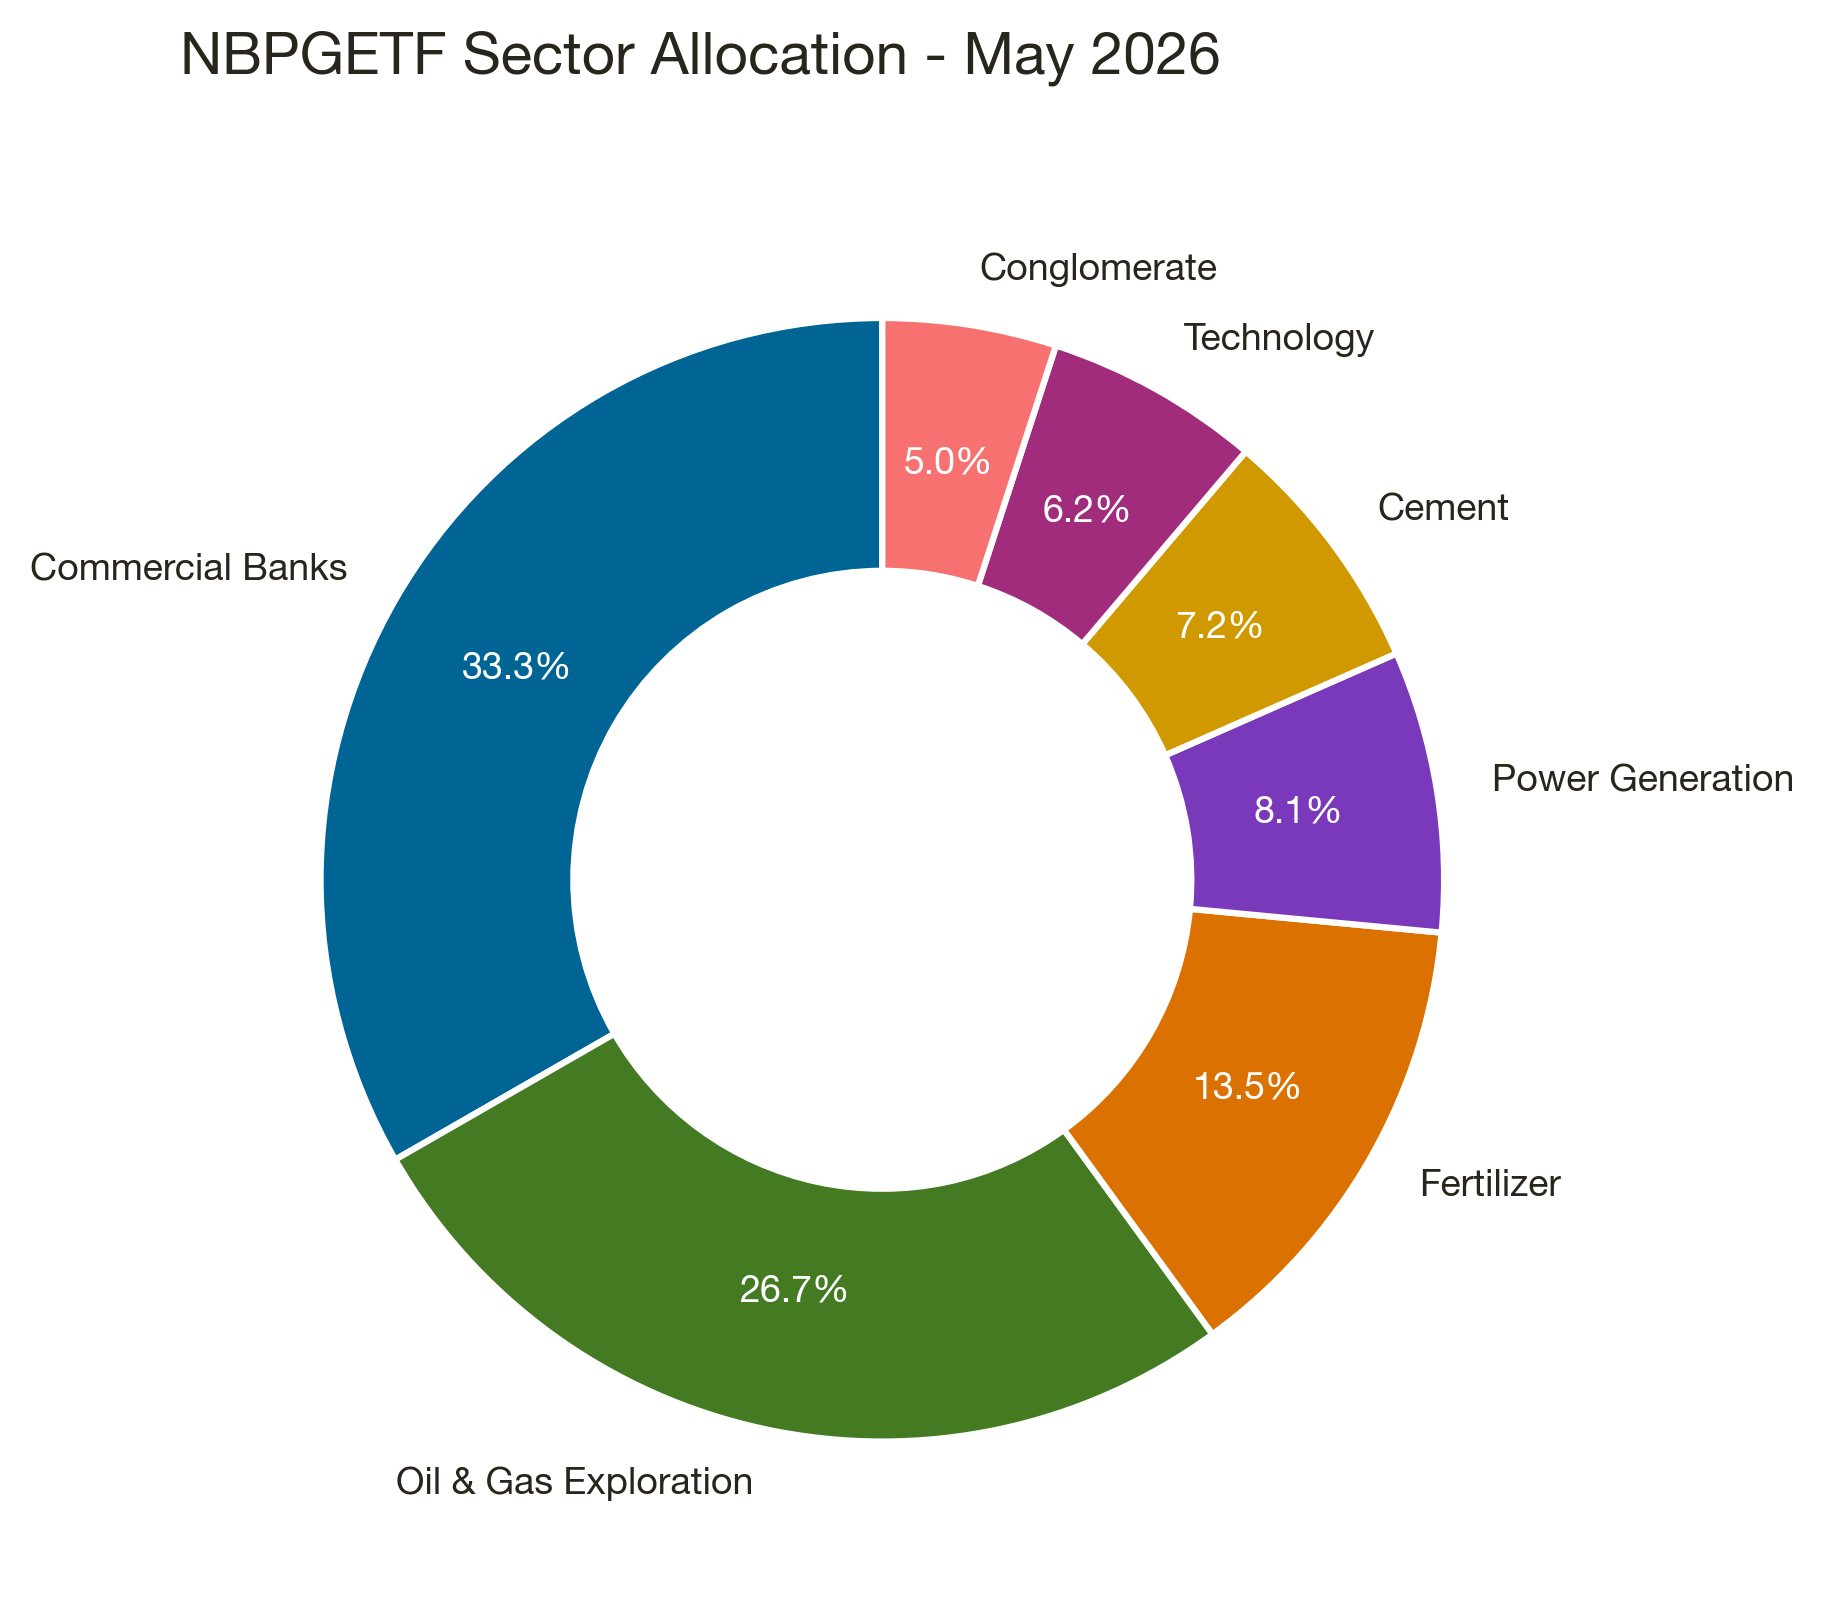
The sector exposure of NBPGETF highlights a strong focus on Financials and Resource Exploration (representing more than 60% of the aggregate portfolio):
Core Observations on the Holdings Basket
- Banking & Resource Heavyweight: With 4 commercial banks, 1 state-owned bank, and 1 Islamic bank, the financial sector represents approximately 33% of the portfolio. This provides strong exposure to bank margin expansions but introduces sector-specific tax risk.
- Growth vs Value Balanced: The tech giant Systems Limited (SYS) at 22.73x P/E acts as the primary tech growth driver, while HBL (5.50x P/E, 0.80x P/B) and NBP (4.52x P/E) offer deep value anchors.
- Resource Diversification: Three major exploration names (MARI, OGDC, PPL) act as dollar-linked resource hedges, protecting the portfolio during inflationary cycles.
NBPGETF Dividend History & Trailing Yield (FY23-FY26)
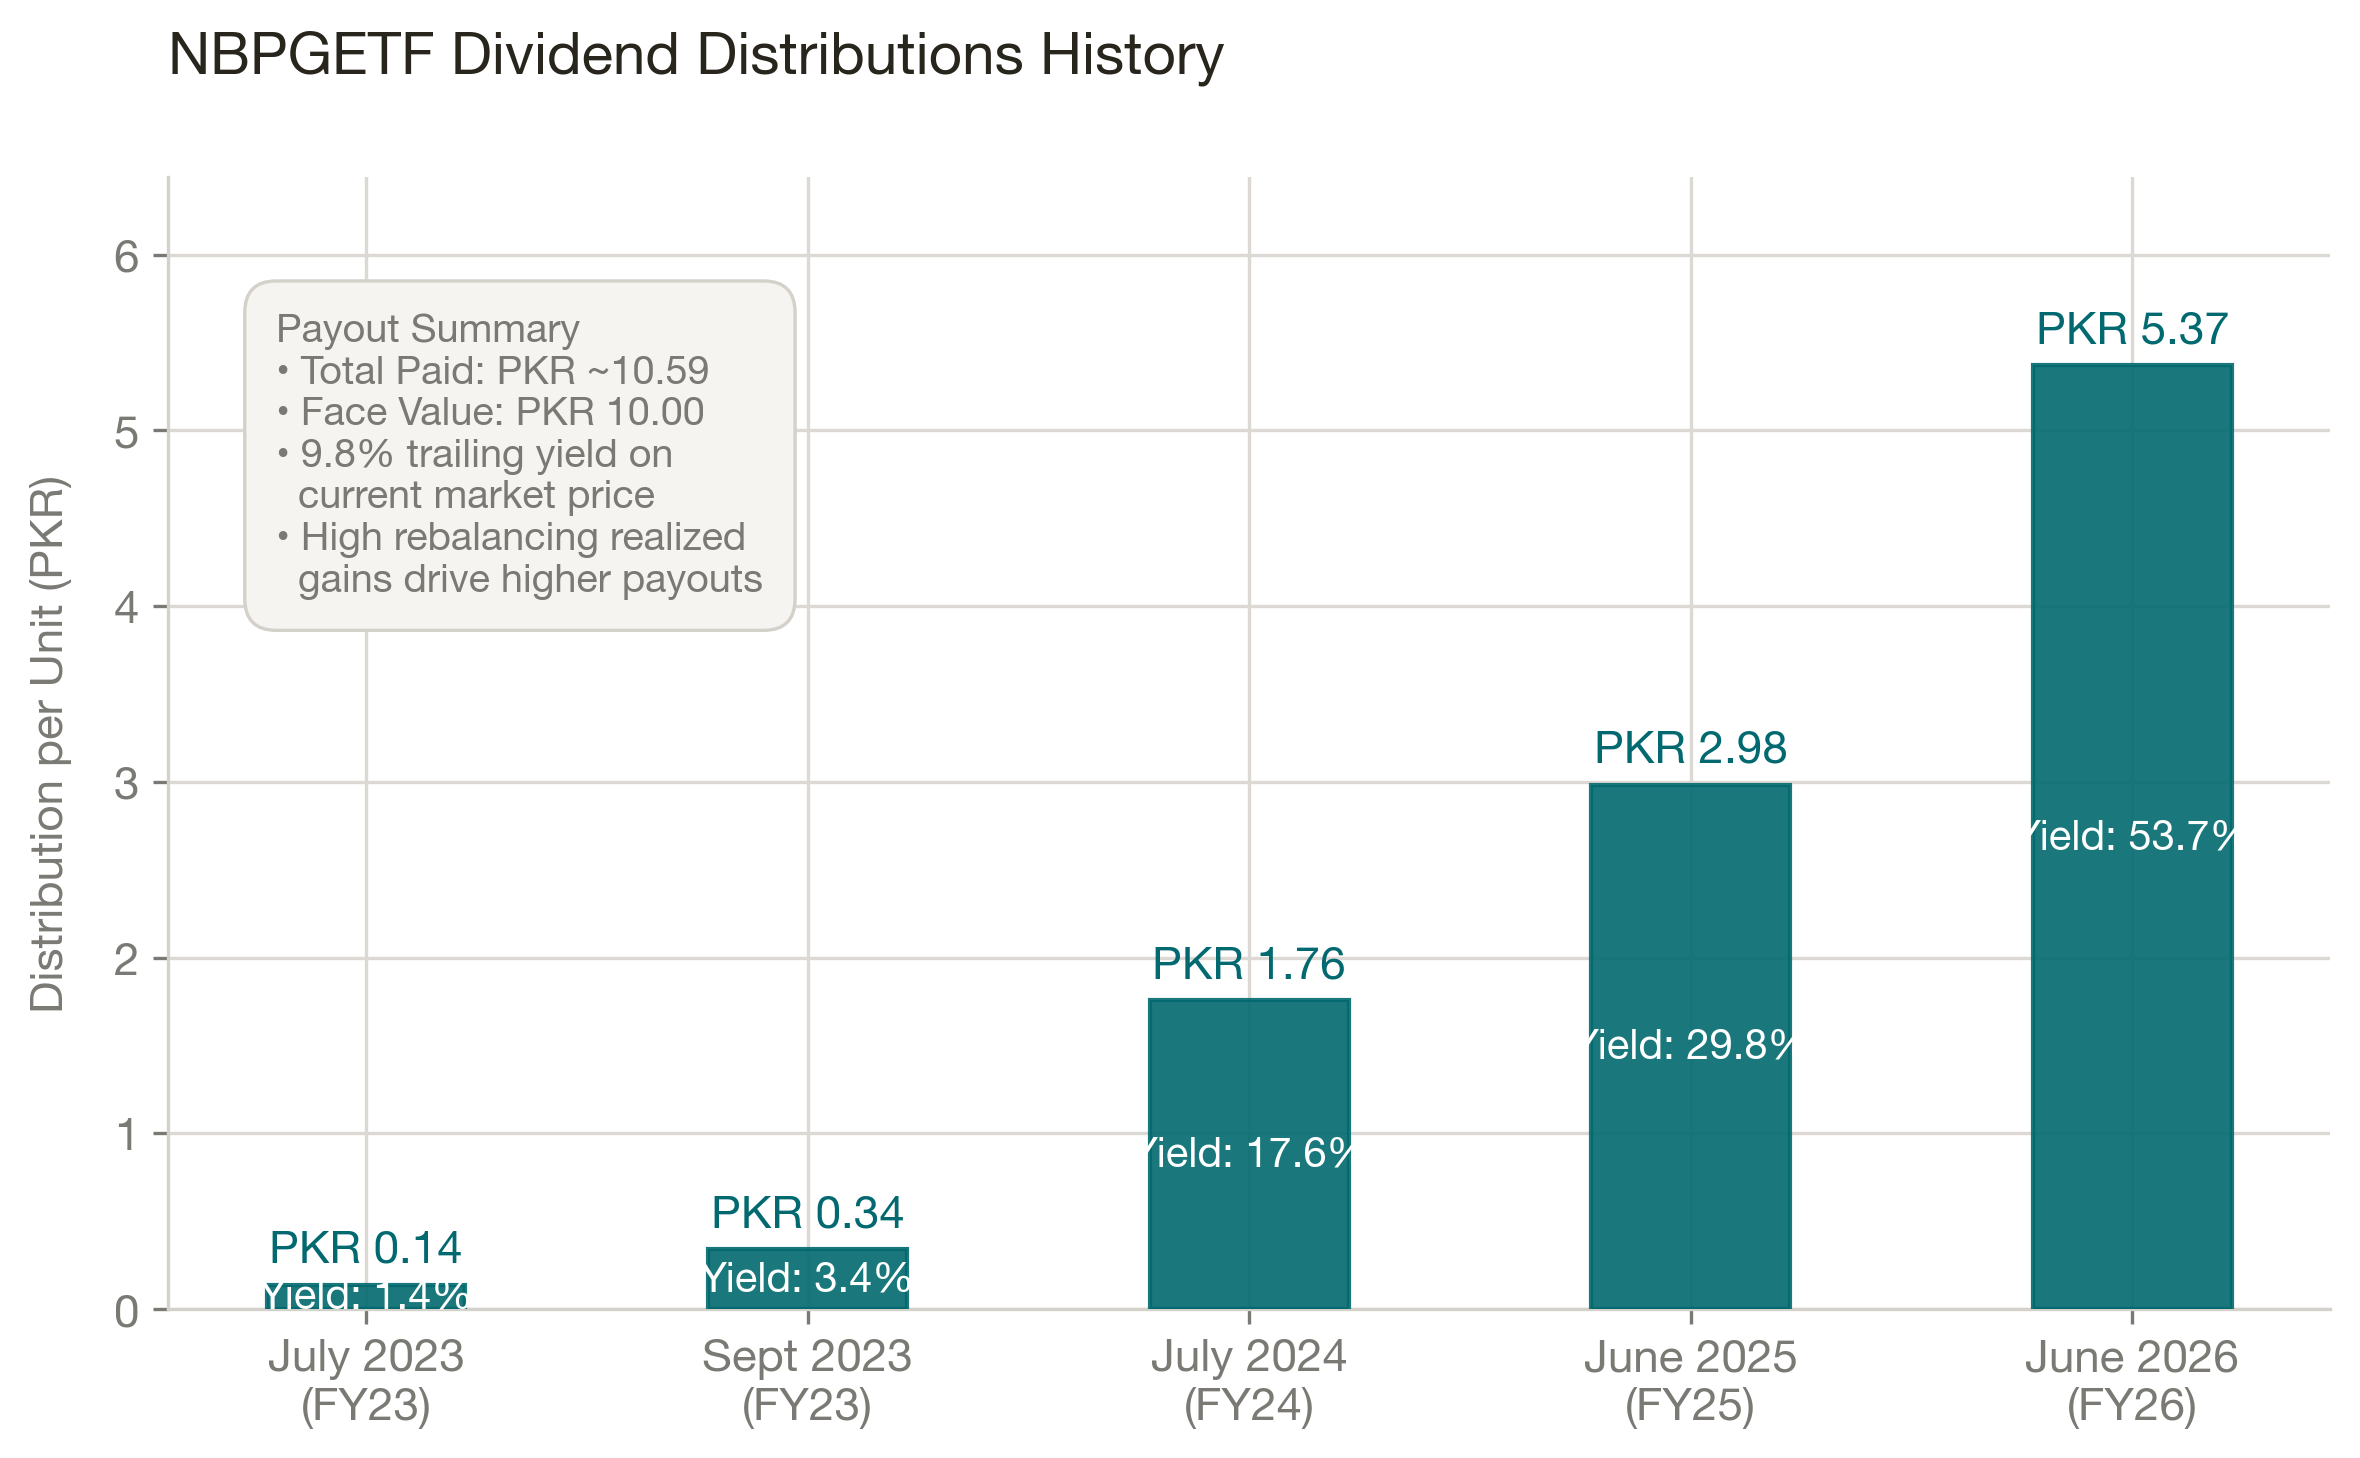
For income-seeking investors, NBPGETF has built one of the most consistent dividend distribution records in the PSX ETF market:
| Date | Financial Year | Payout % of Face Value | PKR per Unit |
|---|---|---|---|
| July 2023 | FY23 | 1.40% | PKR 0.14 |
| September 2023 | FY23 | 3.40% | PKR 0.34 |
| July 2024 | FY24 | 17.57% | PKR 1.757 |
| June 2025 | FY25 | 29.84% | PKR 2.984 |
| June 2026 | FY26 | 53.69% | PKR 5.369 |
Payout data sourced from NBP Fund Management Limited.
The June 2026 distribution of PKR 5.369 per unit was the largest in the fund's history. Based on the current market price of PKR 30.00, this represents an extraordinary 17.7% trailing dividend yield.
This makes NBPGETF a highly attractive vehicle for income seekers. Because the quarterly rebalancing process systematically realizes capital gains by selling overvalued stocks, NBP Fund Managers can pass these realized gains directly to unit holders as cash dividends.
Notable Governance and Operational Flags
When evaluating any financial product, operational history and governance are important components to consider:
- Reconstitution Adjustments: In August 2023, a reconstitution announcement was revoked and then re-issued due to an administrative alignment error. While this resolved without lasting impact, it represents an operational oversight.
- Special Rebalancings: The index has undergone special reconstitutions outside of its standard quarterly schedule-notably on January 3, 2025 to address sudden liquidity changes. Frequent rebalancing can increase transaction drag on the fund.
- Creation Suspension: The fund temporarily suspended unit creation and redemption in April 2025 before resuming on April 25, 2025. Secondary market trading on the PSX remained active throughout this period.
NBPGETF vs NITGETF: The Head-to-Head Comparison
Since both funds track conventional large-cap KSE-100 portfolios, they are natural competitors:
| Feature | NBPGETF | NITGETF |
|---|---|---|
| Management Fee | 0.75% per annum | 0.40% per annum |
| PACRA Rating | AM1 (Elite Quality) | Government-Sponsored |
| AUM Size | PKR 255.7 Million | PKR 214.877 Million |
| 1-Year Return | +38.71% | +40.27% |
| Constituents | 15 (More Diversified) | 13 |
| Trailing Dividend Yield | ~17.9% | ~11.7% |
Final Verdict
If you prioritize the lowest fee and slightly higher returns, NITGETF is the winner. However, if you value the AM1 rating, slightly broader diversification (15 vs 13 stocks), and a stronger trailing dividend yield (17.0% vs 6.4%), NBPGETF is the superior choice.
Is NBPGETF Right for You?
NBPGETF's strongest argument is one it rarely makes explicitly: it is the best single-ticker approximation of KSE-100 exposure currently available on the PSX. Unlike the Shariah ETFs, it holds banks and conventional financial stocks. Unlike UBLPETF, it holds O&G companies. The 15-stock basket is not the KSE-100, but it captures the sector weights that matter most in Pakistan's market.
The tracking gap concern is real and worth naming. NBP Funds uses a proprietary AMC-designed index - not a PSX-published benchmark and quarterly rebalancing creates friction that compounds over time. Investors who want exact benchmark replication will not find it here. But investors who want diversified, conventional large-cap Pakistan equity exposure in a regulated, intraday-tradeable format will find NBPGETF does the job at a reasonable cost.
My recommendation: NBPGETF is the correct foundation for Pakistani investors who are not Shariah-constrained and want broad market coverage. Pair it with MIIETF if you want to add Shariah equity alongside it - the sector overlap is manageable. If you want oil-free blue-chip exposure, compare it with UBLPETF (UBL Pakistan Enterprise ETF) which explicitly excludes the entire O&G sector. For a defensive income allocation alongside your equity core, the HBLTETF (Fixed Income ETF) provides government-backed capital preservation. Skip it in favour of NITGETF if fee minimisation is your primary objective (NITGETF's 0.40% management fee is significantly lower).
Final Verdict
NBPGETF is a solid, professionally managed broad market ETF that delivers disciplined, diversified exposure to Pakistan's 15 most important listed companies in a single, intraday-tradable instrument.
The AM1 management quality rating, quarterly rebalancing, and consistent dividend history are genuine strengths. The tracking gap is the main operational drag, but the fund compensates for it with a strong cash yield.
Our Recommendations:
- For Long-Term Core Investors (Buy): NBPGETF is a solid vehicle for building a core equity position. Consider pairing it with a Shariah-compliant ETF like MIIETF to balance sectoral exposure.
- For Income Seekers (Buy): The trailing yield of approximately 17% is highly competitive. Combined with capital appreciation potential, the total return case is strong if Pakistan's economic recovery continues.
- For Cost-Sensitive Investors (Compare first): While the AM1 rating is valuable, the 0.75% management fee is higher than NITGETF's 0.40%. Cost-sensitive investors may want to compare the two before committing.
Analyze This ETF
Frequently Asked Questions (FAQs)
What is NBPGETF?
NBPGETF is the NBP Pakistan Growth Exchange Traded Fund, listed on the Pakistan Stock Exchange. It tracks the NBP Pakistan Growth Index (NBPPGI), holding 15 blue-chip companies from the KSE-100 across 7 sectors. It is managed by NBP Fund Management Limited and rebalances quarterly.
What is the minimum investment for NBPGETF?
There is no minimum investment for buying NBPGETF on the PSX secondary market. You can purchase a standard board lot of 500 units through any registered PSX broker. At PKR 26.74 per unit, a standard lot costs approximately PKR 15,165, excluding commissions and taxes.
Is NBPGETF Shariah-compliant?
No. NBPGETF holds conventional commercial banks (HBL, MCB, UBL, National Bank of Pakistan) and is not Shariah-screened. Investors seeking halal equity exposure should consider MIIETF or MZNPETF.
How often does NBPGETF rebalance?
NBPGETF has a quarterly weight rebalancing cycle and a semi-annual reconstitution cycle. Weight adjustments occur in approximately February, May, August, and November each year. Stocks are added or removed from the basket twice a year during reconstitution.
Why is NBPGETF's AUM smaller than MIIETF's?
MIIETF benefits from the Al Meezan brand's institutional backing and the large Shariah-compliant investor base in Pakistan. NBPGETF competes in the conventional equity ETF space alongside NITGETF and UBLPETF. The PKR 260.0 million AUM is smaller but sufficient for a functioning ETF market.
Can I buy NBPGETF through my regular broker?
Yes. NBPGETF is listed on the Pakistan Stock Exchange and can be bought or sold during normal trading hours through any registered broker.
Who regulates NBPGETF?
The fund is regulated by the [Securities & Exchange Commission of Pakistan (SECP)](https://www.secp.gov.pk) under the Collective Investment Schemes regulations.
Who manages NBPGETF?
NBPGETF is managed by NBP Fund Management Limited, a subsidiary of the National Bank of Pakistan. The management company holds an AM1 rating from PACRA - the highest asset management quality rating available in Pakistan. The authorized participants are JS Global Capital Limited, MRA Securities, and Adam Securities.
NBPGETF vs NITGETF: which is better?
Both are conventional broad-market equity ETFs with overlapping portfolios (15 vs 13 blue-chip stocks). The key difference: NITGETF has a lower management fee (0.40% vs NBPGETF's 0.75%), but NBPGETF has a stronger trailing dividend yield (~17% vs ~6.4%) and the prestigious AM1 PACRA rating. Cost-sensitive long-term investors may prefer NITGETF; income-seeking investors may prefer NBPGETF's dividend track record. See the full comparison in our NITGETF review.
How do I buy NBPGETF?
Open a SECP-registered PSX brokerage account and search for ticker NBPGETF. Minimum purchase is 500 units (one board lot ≈ PKR 15,165 at current price). See the full comparison in our NITGETF review.
Further Reading
Before investing in NBPGETF, we recommend reviewing the following resources:
- KSE-100 ETF Alternatives in Pakistan - Understand how NBPGETF, NITGETF, MIIETF, and MZNPETF differ as broad-market equity options on the PSX.
- How to Invest in ETFs in Pakistan - A step-by-step guide to buying NBPGETF units through any registered PSX brokerage account.
- Pakistan ETF Expense Ratio Guide - Why NBPGETF's 0.75% management fee matters and how it compares against NITGETF's 0.40% fee over a 5-year horizon.
- All PSX ETFs Ranked: Best ETF in Pakistan - See how NBPGETF's dividend yield and AM1 credit rating factor into the overall PSX ETF ranking.
This article is for educational and informational purposes only. It does not constitute investment advice. Always conduct your own due diligence and consult a qualified financial advisor before making any investment decisions. All data sourced from PSX, MUFAP, and fund factsheets. Past performance is not indicative of future results.
Dr. Faisal Shahzad
Chief Investment Strategist
Dr. Faisal Shahzad holds an MBA from Innsbruck, Austria, and has spent over a decade navigating complex financial markets. He specializes in Exchange Traded Funds (ETFs) and brings extensive, practical knowledge of both international markets and the Pakistan Stock Exchange (PSX).
Expertise: 15+ Years of experience in ETFs, both internationally and on the PSX.
Explore NBPGETF With Our Free Tools
Go deeper on your analysis with institutional-grade analytics built specifically for PSX ETFs.