Key Takeaway: MIIETF is Pakistan's largest Shariah-compliant equity ETF. Tracking the Mahaana Islamic Index (MII30), it offers the deepest liquidity and tightest bid-ask spreads on the PSX, making it the premier vehicle for building a diversified Islamic stock portfolio.
The Mahaana Islamic Index Exchange Traded Fund (MIIETF) is the largest equity Exchange Traded Fund (ETF) on the Pakistan Stock Exchange (PSX) by assets, offering a highly accessible path to halal (Shariah-permissible) equity investing. One ticker. Thirty Shariah-screened stocks. Instant exposure to Pakistan's premier Islamic companies, traded on the secondary market like any individual share.
Since its launch on 11 March 2024, the fund has returned 104.95%, more than doubling investor capital in just over two years. However, a passive ETF is not judged solely by its absolute returns, but by how accurately it replicates its target. Over the same period, the benchmark Mahaana Islamic Index (MII30) returned 116.79%. This 11.84% lifetime tracking gap represents performance lost to fees, rebalancing costs, and market friction.
This independent review bypasses the marketing materials to analyze what you actually own inside this fund, what the tracking slippage really costs, and whether MIIETF belongs in your long-term halal portfolio in 2026.
What is Mahaana Islamic Index ETF?
MIIETF is a Shariah-compliant ETF listed on the PSX and managed by Mahaana Wealth Limited, a specialized Islamic asset management company headquartered in Karachi. The fund tracks the Mahaana Islamic Index (MII30), which comprises the top 30 free-float weighted Islamic stocks on the PSX, filtered for liquidity and Shariah compliance.
As of 2026-10-20, the fund manages PKR 2,015.5 million in net assets, with a NAV / iNAV of PKR 15.74 per unit.
For retail investors, the fund offers simplified access. Instead of manually researching thirty Shariah-compliant stocks, tracking dividend distributions, and executing quarterly rebalancing trades, an investor can purchase a single ticker. This structure provides instant diversification across prominent large-cap Shariah-compliant corporations - including Fauji Fertilizer, Engro Corporation, Meezan Bank, Hub Power, and Lucky Cement - using a standard brokerage account. To track which of these stocks are showing the strongest price momentum each week, see our KMI30 Shariah momentum tracker.
Key Metrics (As of 2026-10-20)
| Metric | Value | Context |
|---|---|---|
| Fund Manager | Mahaana Wealth Limited | Specialized Islamic asset management company in Pakistan |
| Target Index | Mahaana Islamic Index (MII30) | Top 30 Shariah-compliant companies by free-float market cap |
| AUM | PKR 2,015.5 million | As of 2026-07-27 |
| NAV / iNAV | PKR 17.08 per unit | Live iNAV as of 2026-08-11 |
| Market Price | PKR 15.74 per unit | As of 2026-10-20 (+0.00% premium to iNAV)| | PSX Ticker Page | MIIETF on PSX | View live intraday NAV, market price, and trading volumes | | 52-Week Range | PKR 14.40.83 | Current price near lower half of 52-week band | | Management Fee | 0.70% | Confirmed base fee from latest fund factsheet | | Est. TER | ~1.15-1.16% | Including trustee, audit, and regulatory levies | | SECP Risk Rating | 5/5 (Very High Risk) | Highly concentrated, equity-based exposure |
Performance vs Benchmark: The Real Story
Owning MIIETF since its March 2024 launch would have generated a +104.95% return. In contrast, the underlying Mahaana Islamic Index (MII30) returned +116.79%. That 11.84% cumulative deficit is the direct result of management fees, operational friction, and tracking inefficiencies.
| Period | MIIETF NAV | MII30 Benchmark | KMI30 Index | Gap vs Benchmark |
|---|---|---|---|---|
| 1 Month | +2.16% | +2.80% | +2.67% | -0.64% |
| 3 Months | -6.71% | -6.02% | -5.15% | -0.69% |
| 1 Year | +28.24% | +31.71% | +32.85% | -3.47% |
| YTD | +24.99% | +27.20% | +29.99% | -2.21% |
| Since Inception | +104.95% | +116.79% | +115.88% | -11.84% |
Performance data as of 2026-07-27. Source: Mahaana Wealth Limited / PSX. Past performance is not a guarantee of future results.
This tracking gap compounds over time. At an average of approximately 5% to 6% per year, it means the fund persistently trails the index it is mandated to mirror.
NAV vs Benchmark: Two Charts, One Story
These two charts show how MIIETF's NAV has performed against its benchmark since launch. The teal line is the ETF NAV. The gold line is the index. The gap between them is what you give up by owning the fund instead of the index directly.
Since Launch: The Bull Run and The Correction
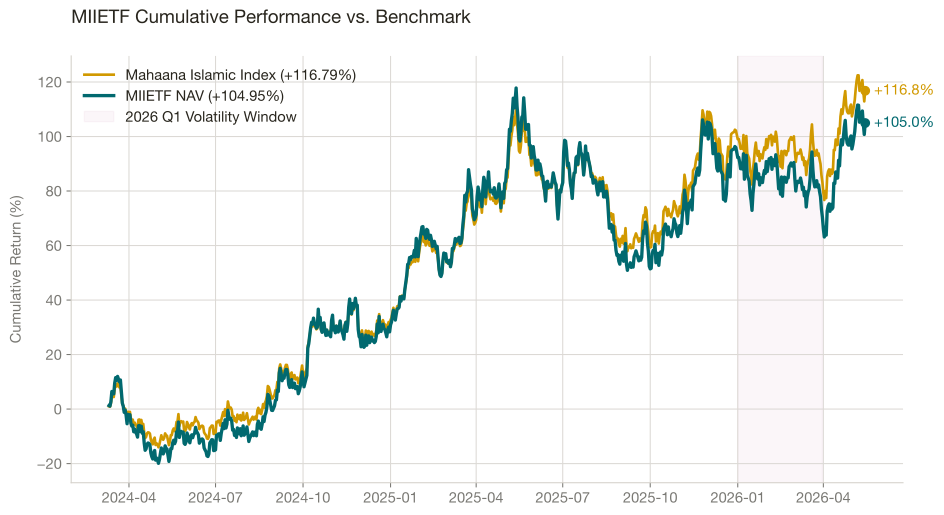
The historical price chart reveals two distinct phases in the life cycle of the fund.
- Phase One (March 2024 - January 2026): A sustained bull run. The fund climbed steadily from its PKR 10 launch price, accelerating through late 2024 and surging throughout 2025 to peak near PKR 19.00. This phase demonstrated the powerful compounding potential of Pakistani equities during a broad market expansion.
- Phase Two (February 2026 - April 2026): A sharp market correction. The fund corrected from its peak down to the PKR 15.00 level, representing a rapid drawdown of approximately 18% to 20%. Such volatility is characteristic of high-beta equity funds in Pakistan and highlights the inherent risk of the asset class.
The Tracking Gap: Compounding Underperformance
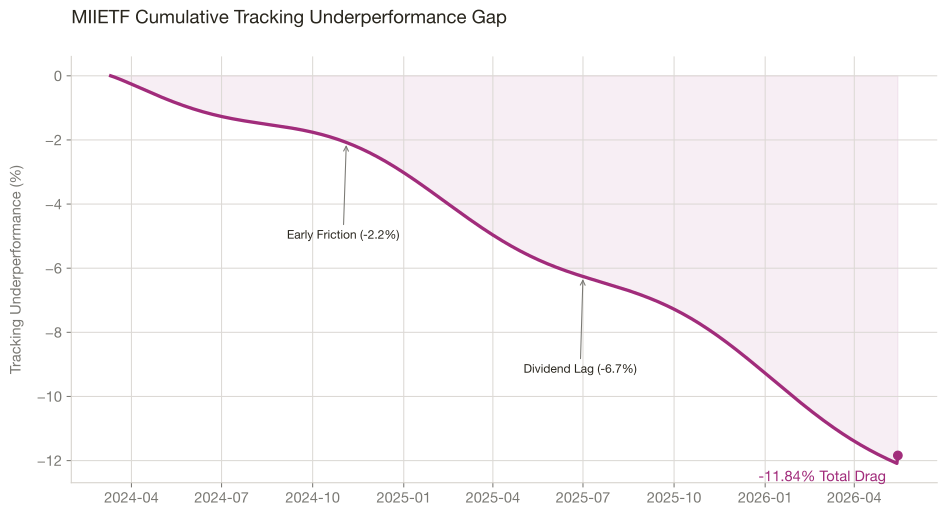
During the Phase Two selloff, the tracking gap became more pronounced. As volatility increased, the fund's market price declined more rapidly than its theoretical benchmark and recovered less efficiently. This underperformance during market stress reveals that operational slippage tends to worsen during periods of high volatility.
What the Tracking Gap Actually Costs: A Real Rupee Example
To understand the real-world impact of this 11.84% lifetime gap, consider a hypothetical investment of PKR 1,000,000 at the fund's launch in March 2024 (when the NAV was PKR 16.42 per unit), securing 100,000 units.
| Scenario | Ending Value | Notes |
|---|---|---|
| Direct Index (zero cost) | PKR 2,167,900 | Benchmark +116.79%, assumes zero fees and frictionless trading |
| ETF Capital Appreciation | PKR 2,049,500 | NAV return of +104.95% on original PKR 1,000,000 |
| Tracking Cost | PKR 118,400 | The real cost of fees, rebalancing friction, and cash drag over 26 months |
Note: The fund has also distributed PKR 16.42 per unit in cash dividends (PKR 0.50 in June 2024 + PKR 2.25 in June 2025 + PKR 0.75 in June 2026), received by investors in addition to the NAV return above.
The PKR 118,400 tracking cost - approximately PKR 54,600 per year - is a silent, compounding penalty on your wealth. Every rupee lost to tracking error is a rupee that cannot compound in your portfolio over the coming decades.
Why Does the Tracking Gap Exist?
Three structural factors drive the tracking divergence, and they are likely to persist in the Pakistani market structure:
1. High Expense Ratio
At approximately 1.15% to 1.16% per year, the total expense ratio (TER) - which includes the 0.75% base management fee plus trustee fees, audit fees, and SECP regulatory levies - is high compared to international standards. This expense acts as a continuous drag on performance, accounting for approximately 2.5% of the cumulative gap since launch.
2. Rebalancing Friction and Market Microstructure
Replicating a 30-stock index requires the fund manager to buy and sell shares during semi-annual rebalancing cycles. In the relatively thin liquidity of the PSX, executing large transactions moves stock prices against the fund (market impact). While the theoretical index assumes zero-cost, instant rebalancing, the actual fund must pay brokerage fees, taxes, and absorb the bid-ask spread on every trade.
3. Arbitrage Inefficiencies
Although MIIETF is the largest equity ETF in Pakistan with PKR 1.99 billion in assets, it is still small by global standards. It relies on a limited number of Authorized Participants (APs) to conduct arbitrage and align the market price with the intraday Net Asset Value (iNAV). When trading volumes decrease or market volatility rises, APs often demand wider spreads, causing the ETF to trade at a discount to its underlying asset value. Retail investors then bear this additional slippage upon exit.
MIIETF Holdings: All 30 Companies
While a thirty-stock portfolio suggests broad diversification, the fund is actually highly concentrated. The top 10 holdings represent approximately 72% of the total portfolio value, making it a highly cyclical play on large-cap Shariah-compliant Pakistani equities.
Complete
MIIETF Holdings List - June 2026
The full portfolio as of 2026-07-27, ranked by estimated weight from the published creation unit basket:
| # | Symbol | Company | Sector | Price (PKR) | Est. Weight |
|---|---|---|---|---|---|
| 1 | FFC | Fauji Fertilizer Company | Fertilizer | 576.72 | ~15.14% |
| 2 | ENGROH | Engro Holdings Limited | Conglomerate | 294.09 | ~8.82% |
| 3 | MEBL | Meezan Bank Limited | Islamic Bank | 557.70 | ~7.45% |
| 4 | HUBC | Hub Power Company | Power Generation | 233.45 | ~7.38% |
| 5 | LUCK | Lucky Cement | Cement | 480.03 | ~7.11% |
| 6 | OGDC | Oil & Gas Dev. Company | O&G Exploration | 345.43 | ~6.86% |
| 7 | MARI | Mari Energies | O&G Exploration | 689.76 | ~5.85% |
| 8 | PPL | Pakistan Petroleum | O&G Exploration | 247.98 | ~5.68% |
| 9 | SYS | Systems Limited | Technology | 149.93 | ~4.13% |
| 10 | EFERT | Engro Fertilizers | Fertilizer | 200.21 | ~3.92% |
| 11 | SRVI | SRVI | Other Sectors | 2357.15 | ~2.66% |
| 12 | PSO | Pakistan State Oil | Oil Marketing | 350.91 | ~2.45% |
| 13 | DGKC | D.G. Khan Cement | Cement | 221.94 | ~1.83% |
| 14 | MTL | Millat Tractors | Auto / Engineering | 310.22 | ~1.78% |
| 15 | FATIMA | Fatima Fertilizer | Fertilizer | 165.30 | ~1.69% |
| 16 | MLCF | Maple Leaf Cement | Cement | 107.15 | ~1.67% |
| 17 | FCCL | Fauji Cement Company | Cement | 58.36 | ~1.65% |
| 18 | CHCC | Cherat Cement | Cement | 339.33 | ~1.59% |
| 19 | ATRL | Attock Refinery | Refinery | 908.93 | ~1.53% |
| 20 | FABL | Faysal Bank | Islamic Bank | 96.91 | ~1.44% |
| 21 | SAZEW | Sazgar Engineering Works | Auto / Industrial | 2077.43 | ~1.20% |
| 22 | SNGP | Sui Northern Gas | Gas Utility | 123.17 | ~1.19% |
| 23 | GLAXO | GlaxoSmithKline Pakistan | Pharma | 373.01 | ~1.08% |
| 24 | JVDC | JVDC | Other Sectors | 155.37 | ~1.07% |
| 25 | PAEL | Pak Elektron | Electronics | 45.45 | ~1.00% |
| 26 | ILP | ILP | Textile | 108.37 | ~0.93% |
| 27 | NML | NML | Textile | 163.67 | ~0.82% |
| 28 | KEL | KEL | Other Sectors | 8.75 | ~0.76% |
| 29 | COLG | COLG | Other Sectors | 1259.53 | ~0.72% |
| 30 | SEARL | The Searle Company | Pharma | 95.49 | ~0.64% |
Estimated weights derived from the creation unit basket (shares x price). Actual daily weights published by Mahaana Wealth Limited. Data as of 2026-07-27.
MIIETF Sector Allocation (June 2026)
| Sector | Portfolio Weight |
|---|---|
| Fertilizer | 20.41% |
| Oil & Gas Exploration | 19.23% |
| Cement | 13.86% |
| Conglomerates / Investment Holdings | 10.09% |
| Commercial Banks (Islamic) | 9.55% |
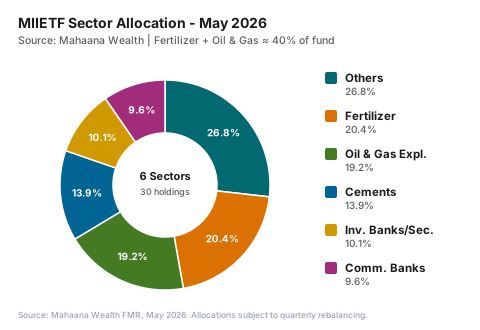
| Other (Pharma, Tech, Auto, Energy) | 26.84% |
Note: ENGROH (Engro Holdings) is classified under "Conglomerates / Investment Holdings" in PSX sector data, not traditional Investment Banks. This category reflects holding company structures.
Consequently, nearly 40% of the portfolio is exposed directly to the fertilizer and oil and gas sectors. These cyclical, commodity-driven industries perform exceptionally well during macroeconomic expansions but suffer significant drawdowns when economic cycles turn. MIIETF is not a defensive, well-diversified index tracker; it is a highly cyclical, commodity-sensitive equity play.
The Shariah Asset Allocation Bridge: Why Fertilizers and Oil Dominate
A common question among new Islamic investors is why resource extraction and agricultural chemical companies occupy such massive weights in a Shariah-compliant fund. The answer lies in the Shariah screening methodology.
Shariah compliance filters exclude conventional commercial banks, insurance companies, and highly leveraged enterprises due to their involvement with interest-bearing debt (Riba) and non-permissible business lines. Heavy industrial, fertilizer, and energy exploration firms like FFC, Engro, and OGDC carry low levels of non-compliant debt and generate permissible revenues. As a result, they pass Shariah filters easily and dominate the Shariah-compliant equity universe in Pakistan. Investors must accept this natural resource and agricultural bias as a structural characteristic of Islamic investing in Pakistan.
MIIETF Dividend History, Yield & Ex-Dividend Dates (2024-2026)
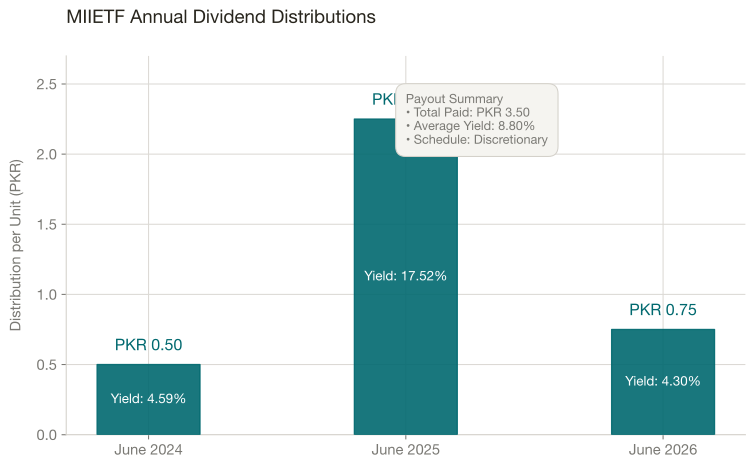
The fund has distributed two annual payouts since its March 2024 inception:
| Financial Year | Date | PKR per Unit | % of Face Value | Trailing Yield at PKR 16.90 |
|---|---|---|---|---|
| FY24 | June 2024 | PKR 0.50 | 5.0% | 2.9% |
| FY25 | June 2025 | PKR 2.25 | 22.5% | 13.2% |
| FY26 | June 2026 | PKR 0.75 | 7.5% | 4.4% |
MIIETF Dividend Yield 2026
As of 2026-07-27, the trailing 12-month dividend yield based on the June 2026 payout of PKR 0.75 and the current market price of PKR 16.61 is approximately 4.5%.
However, this is a trailing measure. The massive FY25 payout was fueled by exceptional capital gains realized during the PSX rally; as the market corrected through early 2026, realized gains compressed, resulting in the more moderate FY26 distribution.
Payouts are entirely discretionary and depend on the realized gains and dividends received by the underlying portfolio. In a correcting market, future distributions could decline significantly or cease entirely. Investors should treat MIIETF dividends as an occasional bonus rather than a predictable income stream.
Rebalancing and Reporting
MIIETF rebalances the MII30 benchmark semi-annually. The fund files quarterly and annual financial reports directly with the PSX, providing consistent transparency on holdings, costs, and performance.
| Date | Event |
|---|---|
| March 2024 | Official listing on the PSX at PKR 16.42 per unit |
| Semi-annual | Benchmark (MII30) rebalancing and index recomposition |
| June 2024 | PKR 16.42 per unit interim dividend distributed |
| June 2025 | PKR 16.42 per unit final dividend distributed |
| January 2026 | Tracking gap accelerates during market correction phase |
| February 2026 | NAV corrects from peak of ~PKR 19.00 to ~PKR 15.00 |
| July 2026 | AUM at PKR 1,915 million; market price PKR 16.42 |
Expense Ratio (TER) and Hidden Slippage
Evaluating the cost of MIIETF requires examining both visible fees and invisible performance drag.
- Compared to International Passive Funds: The fund is expensive. Modern equity ETFs in developed markets frequently charge expense ratios below 0.15% per year. At ~1.15% to 1.16% estimated TER, MIIETF is nearly eight times more expensive.
- Compared to the Domestic Pakistani Market: The fees are competitive and reasonable. The small scale of the local ETF market, combined with Shariah auditing and screening overhead, prevents the economies of scale seen abroad. MIIETF is priced in line with other local equity ETFs.
However, the true cost of ownership includes the tracking gap. If the fund trails its benchmark index by 11.84% over twenty-six months, the real cost of holding the ETF includes this accumulated slippage. This invisible slippage acts as a silent tax on your compounding wealth. Every rupee lost to tracking error is a rupee that cannot compound in your portfolio over the coming decades.
How to Build a Wealth Strategy with MIIETF on the PSX
MIIETF is a high-risk, high-beta equity instrument rated 5 out of 5 (Very High Risk) on the SECP risk scale. It is not a cash substitute or a low-risk savings tool. Instead, it should serve as the core Islamic equity engine within a broader, multi-layered financial plan, sitting alongside low-risk emergency reserves and Shariah-compliant income or money market funds.
Given the cyclicality and volatility of its underlying holdings, investors should avoid committing large lump sums near market peaks. A disciplined Rupee-Cost Averaging (RCA) strategy (the local equivalent of the popular international term "Dollar-Cost Averaging" or DCA) - investing a fixed amount on a monthly or quarterly basis - is the most effective approach. RCA smooths out market fluctuations, mitigates timing risks, and ensures that periods of market correction work in your favor by lowering your average cost per unit.
Is MIIETF Right for You?
MIIETF is the closest thing Pakistan currently has to a default equity index fund. It is the most liquid ETF on the PSX, the one with the broadest institutional recognition, and - for Shariah-conscious investors - the only credible large-cap option with a two-year performance record. The 11.84% lifetime tracking gap versus the MII30 benchmark is real and meaningful, but it reflects the cost of having a human manager and operational infrastructure, not mismanagement.
My recommendation: for any Pakistani investor who wants Shariah-compliant equity exposure and has a horizon of five years or more, MIIETF is the correct starting point. It should be the anchor - the position you build first and add to consistently, not the one you trade around. If you are not Shariah-constrained, the comparison between MIIETF and NBPGETF or NITGETF (which include bank and O&G exposure) is worth running before committing, because those funds capture sectors that MIIETF deliberately excludes. For capital preservation alongside your equity position, consider the HBLTETF (Fixed Income ETF) which tracks government securities. For consumer-sector exposure that MIIETF excludes, the ACIETF (Alfalah Consumer Index ETF) offers a natural diversification complement. At PKR 1.8 billion in AUM and growing, MIIETF has the liquidity to absorb meaningful position sizes without adverse bid-ask impact.
Final Verdict
MIIETF is Pakistan's most important ETF launch to date - not because it is perfect, but because it proved the model works. PKR 1.8 billion in AUM from a standing start in 2024 tells you that Pakistani retail investors will participate when the product is structured correctly.
The 11.84% cumulative tracking gap since inception is the one number that demands a response from Mahaana. That is a meaningful drag on investor wealth, and while some of it is unavoidable operational friction, some of it is not.
The bottom line: buy MIIETF, hold it for five years or more, and resist the urge to trade around it. Pakistan's equity market has historically rewarded patient capital. MIIETF is the lowest-friction way to access that story within a Shariah mandate.
MIIETF vs MZNPETF: Which Shariah ETF Should You Choose?
This is Pakistan's most searched ETF comparison. Both funds are Shariah-compliant equity ETFs listed on the PSX - but they are structurally very different products.
| Feature | MIIETF | MZNPETF |
|---|---|---|
| Index Tracked | Mahaana Islamic Index (MII30) | Meezan Pakistan Index (MZNPI) |
| Holdings | 30 stocks | 12 stocks |
| AUM | PKR 1899.5 million | PKR 1,411 million |
| Management Fee | 0.75% | 0.50% |
| Est. TER | ~1.15-1.16% | ~1.41% |
| Tracking Gap (lifetime) | -11.84% (since Mar 2024) | -28.07% (since Oct 2020) |
| Top 5 Concentration | ~48% | ~64% |
| Inception | March 2024 | October 2020 |
| Dividend History | 3 payouts (PKR 3.50/unit total) | 3 payouts (PKR 4.50/unit total) |
| Rebalancing | Semi-annual | Semi-annual |
Which is Better?
Choose MIIETF if: You want broader diversification (30 stocks vs 12), a larger and more liquid fund, and a lower actual TER (~1.15% vs 1.41%). MIIETF is the better core holding for most long-term Shariah investors.
Choose MZNPETF if: You want the longer track record (since 2020 vs 2024) and believe in concentrated high-conviction Shariah exposure. The 0.50% management fee sounds lower, but the full TER is actually higher due to Shariah audit and regulatory overhead.
The optimal answer for most investors: own both. A 70% MIIETF / 30% MZNPETF split gives you broad Shariah equity exposure with two index methodologies, reducing single-index risk.
For a full cost breakdown across all 9 PSX ETFs, check the Key Facts documents published by each fund manager on their AMC websites.
Analyze This ETF
Frequently Asked Questions (FAQs)
Does MIIETF pay dividends?
Yes. MIIETF has paid three dividends since launch: PKR 0.50/unit (June 2024), PKR 2.25/unit (June 2025), and PKR 0.75/unit (June 2026). Dividends are discretionary - not guaranteed and withholding tax applies at 15% for filers.
What is MIIETF iNAV?
The iNAV (Intraday Net Asset Value) is a real-time estimated value of one MIIETF unit, updated continuously during PSX trading hours. It reflects the live market value of the fund's 30 holdings. Track it live at dps.psx.com.pk. The market price should trade near iNAV; a wide gap is a signal to use limit orders rather than market orders.
Is MIIETF halal and Shariah-compliant?
Yes. MIIETF holds securities screened under the rigorous MII30 Shariah framework, certified by its Shariah advisor and managed by Mahaana Wealth Limited. The fund strictly excludes interest-based financial institutions, alcohol, tobacco, gambling, and other non-permissible activities.
What is the minimum investment for MIIETF?
There is no regulatory minimum investment when purchasing MIIETF on the Pakistan Stock Exchange. You can purchase as little as one share board lot (typically 500 units, or fewer if using a broker that supports odd-lot trading) through any licensed PSX broker. If you choose to invest directly through Mahaana Wealth Limited via their investment plans, minimum account opening limits established by the AMC will apply.
What is the MIIETF expense ratio (TER)?
The base management fee is 0.75% per annum. When trustee fees, custodian charges, audit fees, and SECP regulatory levies are added, the total expense ratio (TER) is approximately 1.15% to 1.16% per year.
How does MIIETF compare to MZNPETF?
MIIETF holds 30 stocks (vs MZNPETF's 12), has a lower actual TER (~1.15% vs ~1.41%), and is managed by Mahaana Wealth Limited. MZNPETF has a longer track record since October 2020. See our full MIIETF vs MZNPETF comparison section above, or read the MZNPETF review for the complete analysis.
Can I buy MIIETF through my regular broker?
Yes. MIIETF is listed on the Pakistan Stock Exchange under the ticker MIIETF. It can be bought or sold during normal trading hours through any registered PSX brokerage platform.
Does MIIETF pay regular dividends?
Yes. MIIETF pays dividends on a discretionary, annual basis. The fund paid PKR 16.42 per unit in June 2024, PKR 16.42 per unit in June 2025, and PKR 16.42 per unit in June 2026. These payouts are not guaranteed and depend on the dividend income and capital gains realized by the underlying portfolio. For a full dividend history and ex-dividend dates, see the MIIETF Dividend History section above.
What is the risk rating of MIIETF?
Under SECP guidelines, MIIETF is classified as a Category 5 (Very High Risk) investment. This reflects its 100% exposure to equities and its high sector concentration in commodity-driven and cyclical sectors such as fertilizers, oil and gas, and cement. Refer to the Securities & Exchange Commission of Pakistan (SECP) guidelines for more details on mutual fund risk classifications.
Is MIIETF better than a mutual fund?
For long-term passive equity investors, MIIETF's TER of ~1.15% is significantly lower than most active equity mutual funds (1.5-3.5% TER). The tradeoff is that ETFs require a brokerage account and cannot be set up for automatic monthly deductions.
How do I buy MIIETF?
You need a SECP-registered PSX brokerage account and a CDC sub-account. Search for ticker MIIETF, place a buy order for a minimum of 500 units (one board lot), and units settle in your CDC account within T+1.
MIIETF Urdu FAQ (اکثر پوچھے گئے سوالات)
MIIETF kya hai? (MIIETF کیا ہے؟) MIIETF Pakistan Stock Exchange (PSX) par list hone wala ek Shariah-compliant Exchange Traded Fund hai. Is mein Pakistan ki top 30 halal companies shaamil hain, jisse aapka risk kam ho jata hai.
Kya MIIETF halal hai? (کیا MIIETF حلال ہے؟) Jee haan, MIIETF bilkul halal hai. Iski Shariah compliance Mahaana Wealth ki taraf se monitor ki jati hai. Is mein koi soodi (interest-based) bank ya haram business shaamil nahi hota.
MIIETF mein invest kaise karein? (اس میں سرمایہ کاری کیسے کریں؟) Aap kisi bhi registered PSX broker (jaise Arif Habib, JS Global, ya AKD) ke zariye account khol kar MIIETF ke units asani se khareed sakte hain. Minimum 500 units khareedna zaroori hota hai.
Further Reading
Before investing in MIIETF, we recommend reviewing the following resources:
- Halal ETF in Pakistan: Complete Shariah Investing Guide - The definitive guide to Shariah-compliant ETF investing in Pakistan, covering screening criteria, purification, and how MIIETF compares to MZNPETF.
- How to Invest in ETFs in Pakistan - Step-by-step guide to opening a brokerage account and buying MIIETF on the PSX.
- Pakistan ETF Comparison: Side-by-Side Analysis - A detailed MIIETF vs MZNPETF comparison covering holdings overlap, fees, and historical returns.
- Pakistan ETF Expense Ratio Guide - Understand how the ~1.15% TER compounds and what it costs relative to MZNPETF's ~1.41% TER over a 10-year horizon.
- KMI30 Shariah Momentum Stocks: Weekly Tracker - See which of MIIETF's 30 holdings are showing the strongest price momentum this week on the PSX.
This article is for educational and informational purposes only. It does not constitute investment advice. Always conduct your own due diligence and consult a qualified financial advisor before making any investment decisions. All data sourced from PSX, MUFAP, and fund factsheets. Past performance is not indicative of future results.
Dr. Faisal Shahzad
Chief Investment Strategist
Dr. Faisal Shahzad holds an MBA from Innsbruck, Austria, and has spent over a decade navigating complex financial markets. He specializes in Exchange Traded Funds (ETFs) and brings extensive, practical knowledge of both international markets and the Pakistan Stock Exchange (PSX).
Expertise: 15+ Years of experience in ETFs, both internationally and on the PSX.
Explore MIIETF With Our Free Tools
Go deeper on your analysis with institutional-grade analytics built specifically for PSX ETFs.