Key Takeaway: JSMFETF is the only smart-beta momentum ETF on the PSX. It systematically shifts assets monthly into the 10 strongest-performing stocks, making it a high-growth, high-volatility vehicle that excels in bull markets but carries tracking gap risks.
The JS Momentum Factor Exchange Traded Fund (JSMFETF) is the only smart-beta exchange-traded fund listed on the Pakistan Stock Exchange (PSX). It does not select companies based on market capitalization or Shariah compliance. Instead, it tracks price momentum - the market pattern where stocks that have risen strongly in recent months tend to keep rising in the near term.
As of 2026-08-11, JSMFETF trades at PKR 10.72 per unit, at a +0.19% to iNAV to its live Net Asset Value (iNAV) of PKR 9.94. The fund has 142.51 million outstanding units with a total Asset Under Management (AUM) of PKR 1120.0 million (Rs. 1.44 billion). This makes it the third largest ETF by AUM on the PSX, behind MIIETF and MZNPETF. Its 52-week range of PKR 9.22 to PKR 14.14 highlights the significant volatility of its underlying momentum strategy.
This independent review analyzes the mechanics of JSMFETF, the tracking gap, and whether this momentum strategy belongs in your portfolio in 2026.
What is JSMFETF?
JSMFETF is an open-ended Smart Beta ETF that tracks the JS Momentum Factor Index (JSMFI). This index selects 10 PSX-listed stocks based entirely on price momentum. Every month, the index is reconstituted to hold the 10 stocks that have demonstrated the strongest relative price performance over the past 30, 60, and 90 days.
The fund is managed by JS Investments Limited, a prominent asset manager in Pakistan with a PACRA AM1 rating. The trustee is CDC Pakistan Limited, and the auditor is A.F. Ferguson & Company. The fund was established under the Sindh Trust Act 2020 with a trust deed date of 5 October 2021 and officially listed on the PSX on 7 January 2022.
For investors, this fund offers a systematic way to implement momentum investing. Instead of manually buying and selling individual stocks, you buy one ticker, and the fund automatically rotates the portfolio into the strongest-performing stocks every month.
Key Metrics (As of 2026-10-18)
| Metric | Value | Context |
|---|---|---|
| Full Name | JS Momentum Factor Exchange Traded Fund | Pakistan's only factor-based / Smart Beta ETF |
| Ticker | JSMFETF | Listed on the Pakistan Stock Exchange |
| Launch Date | 7 January 2022 | Over four years of live trading history |
| Fund Manager | JS Investments Limited | PACRA AM1 rated asset management company |
| Benchmark | JS Momentum Factor Index (JSMFI) | 10 high-momentum stocks weighted by volume |
| AUM | PKR 1342.2 million | Third largest ETF on the PSX |
| Outstanding Units | 142,510,000 | High liquidity compared to other PSX ETFs |
| NAV (iNAV) | PKR 10.70 per unit | Live iNAV as of 2026-08-11 |
| iNAV as of 2026-07-27; published intraday by PSX | ||
| Market Price | PKR 10.72 per unit | As of 2026-08-11 (+0.19% to iNAV) |
| PSX Ticker Page | JSMFETF on PSX | View live intraday NAV, market price, and trading volumes |
| 52-Week Range | PKR 9.22 - PKR 14.14 | Highly volatile return path |
| Management Fee | Up to 0.75% per annum | Base fee on average daily net assets |
| Rebalancing Frequency | Monthly | The most active rebalancing schedule on the PSX |
| Single Stock Limit | 20.00% maximum | BOP and UBL are currently capped at 20.00% |
The most notable metrics are the monthly rebalancing frequency and the AUM size. Rebalancing ten stocks every month creates high portfolio turnover, which has a major impact on both the transaction fees and the dividend payouts of the fund.
The Momentum Strategy Edge: How Stocks Are Selected
The benchmark JS Momentum Factor Index (JSMFI) uses a rules-based, quantitative methodology to select and weight its constituents:
- Universe Filtering: All shares listed on the PSX are screened for minimum liquidity and free-float requirements.
- Momentum Scoring: For each eligible share, a composite momentum score is calculated using price performance over 30-day, 60-day, and 90-day periods.
- Selection: The top 10 shares with the highest composite momentum scores are selected for the portfolio.
- Weighting: The selected stocks are weighted based on their pro-rata share of total traded value among the 10 constituents.
- Capping: No single stock can exceed 20.00% of the portfolio at the time of reconstitution. Any excess weight is redistributed proportionally among the remaining stocks.
- Monthly Reconstitution: The entire process is repeated monthly to ensure the fund remains aligned with the latest market trends.
Historical Backtest vs. Live Performance: The historical backtest from 2001 to 2021 indicated that the JSMFI strategy outperformed the KSE All-Share Index by 6.00% per year, achieving a Sharpe Ratio of 1.59 versus 1.25 for the index. However, since its live launch in 2022, the fund has faced several periods of underperformance due to market cycle reversals.
Performance: The Real Numbers
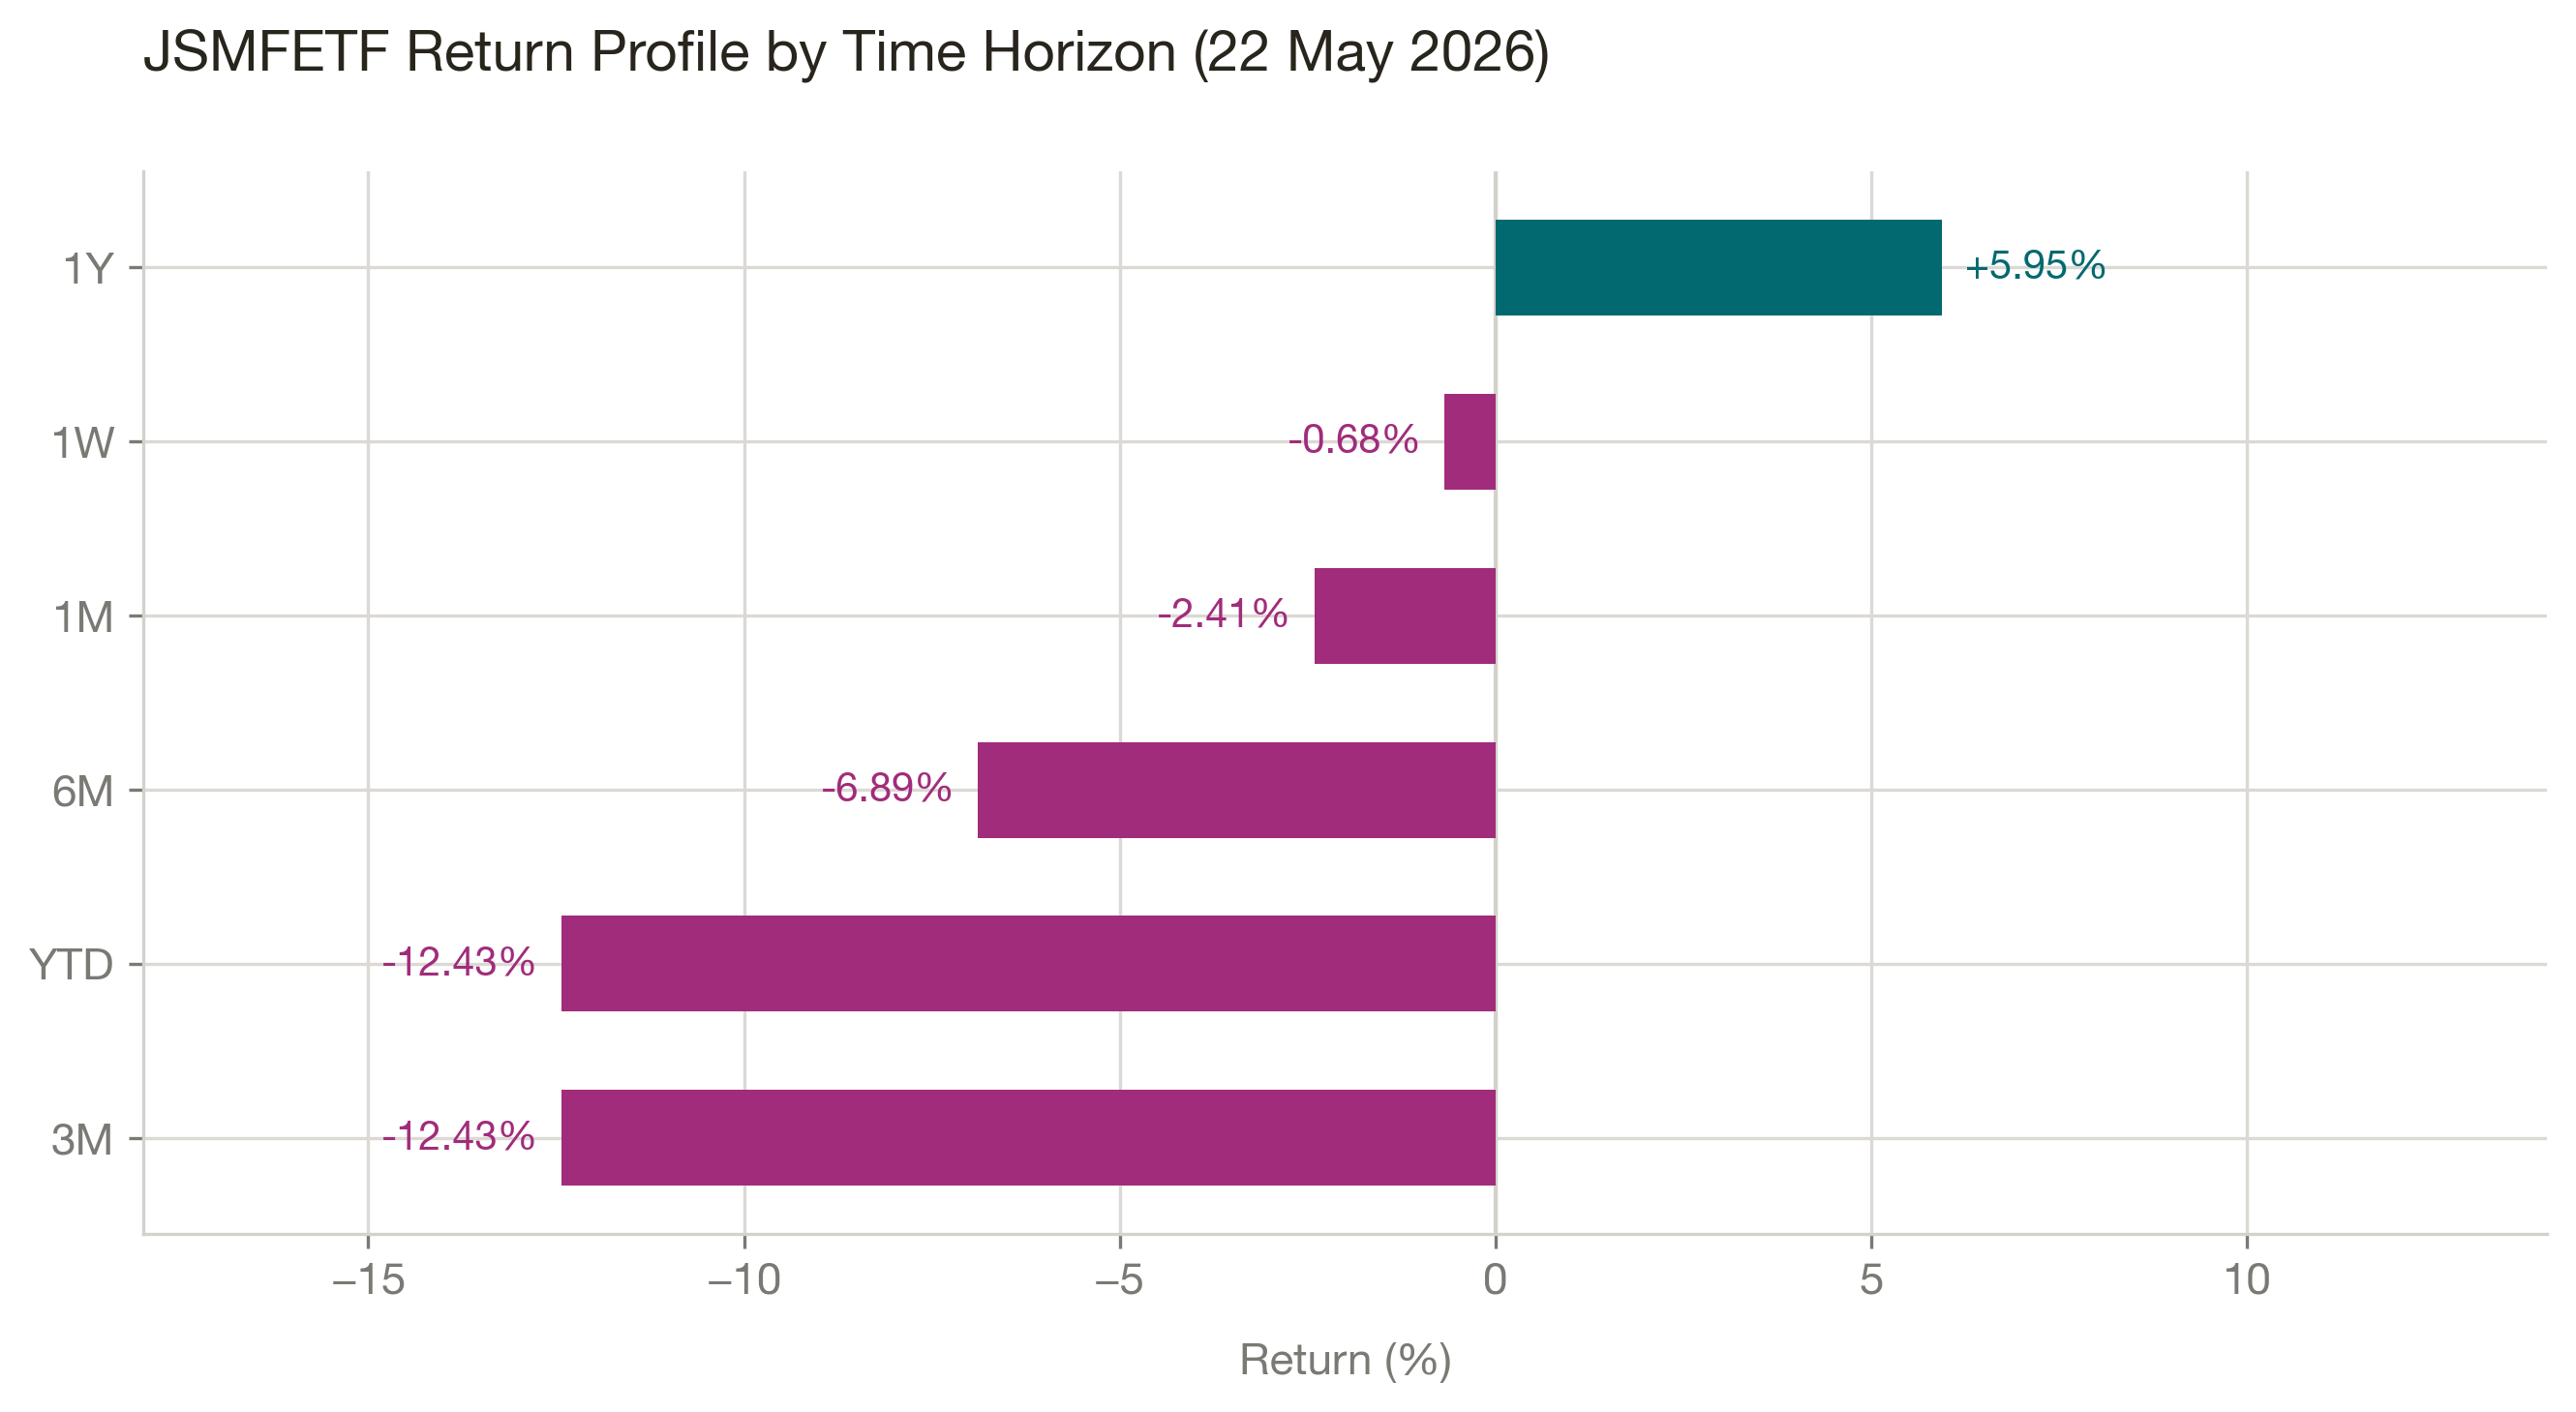
The return profile of JSMFETF as of 2026-07-27 highlights the challenges that momentum strategies face during volatile market phases.
| Horizon | Market Price Return | NAV Return | Benchmark Return | Tracking Gap |
|---|---|---|---|---|
| 1 Week | -0.68% | -0.68% | -0.55% | -0.13pp |
| 1 Month | -2.41% | -2.41% | -2.15% | -0.26pp |
| 3 Months | -12.43% | -12.43% | -15.00% | +2.57pp (NAV leads) |
| 6 Months | -6.89% | -6.89% | -8.00% | +1.11pp (NAV leads) |
| 1 Year | +5.95% | +5.95% | +35.00% | -29.05pp (Index leads) |
| YTD | -12.43% | -12.43% | -15.00% | +2.57pp (NAV leads) |
| Since Launch | +46.85% | +45.00% | +130.00% | -85.00pp (Index leads) |
Performance data as of 2026-07-27. Source: JS Investments Limited / PSX. Past performance is not a guarantee of future results.
To understand these figures, you must analyze the performance tracking gaps.
Gap 1: Market Price vs. NAV
JSMFETF generally trades very close to its Net Asset Value. The current premium of +0.30% indicates that the market makers are providing adequate liquidity, preventing the large premiums or discounts that affect other thinly traded ETFs on the PSX.
Gap 2: NAV vs. Benchmark
The cumulative return of the NAV since launch is +45.00%, compared to +130.00% for the benchmark index. This tracking gap of -85.00 percentage points appears large, but it is primarily driven by two factors:
- Cash Dividend Distributions: The benchmark is a total-return index that assumes immediate, cost-free reinvestment of all dividends. JSMFETF does not reinvest dividends; it distributes them in cash. The fund has paid out PKR 9.94 per unit in cash since launch. When these distributions are added back, the performance gap narrows significantly.
- Transaction Costs and Fees: Monthly rebalancing requires selling ten stocks and buying ten new ones. This high turnover generates brokerage commissions, taxes, and market impact costs that drag on the NAV.
NAV vs. Benchmark: Three Charts, One Story
These three charts illustrate how JSMFETF has performed against its benchmark index across different time horizons. The primary takeaway is that momentum performs exceptionally well during sustained trends but lags during sharp market rotations.
YTD: Protecting Capital in a Reversal
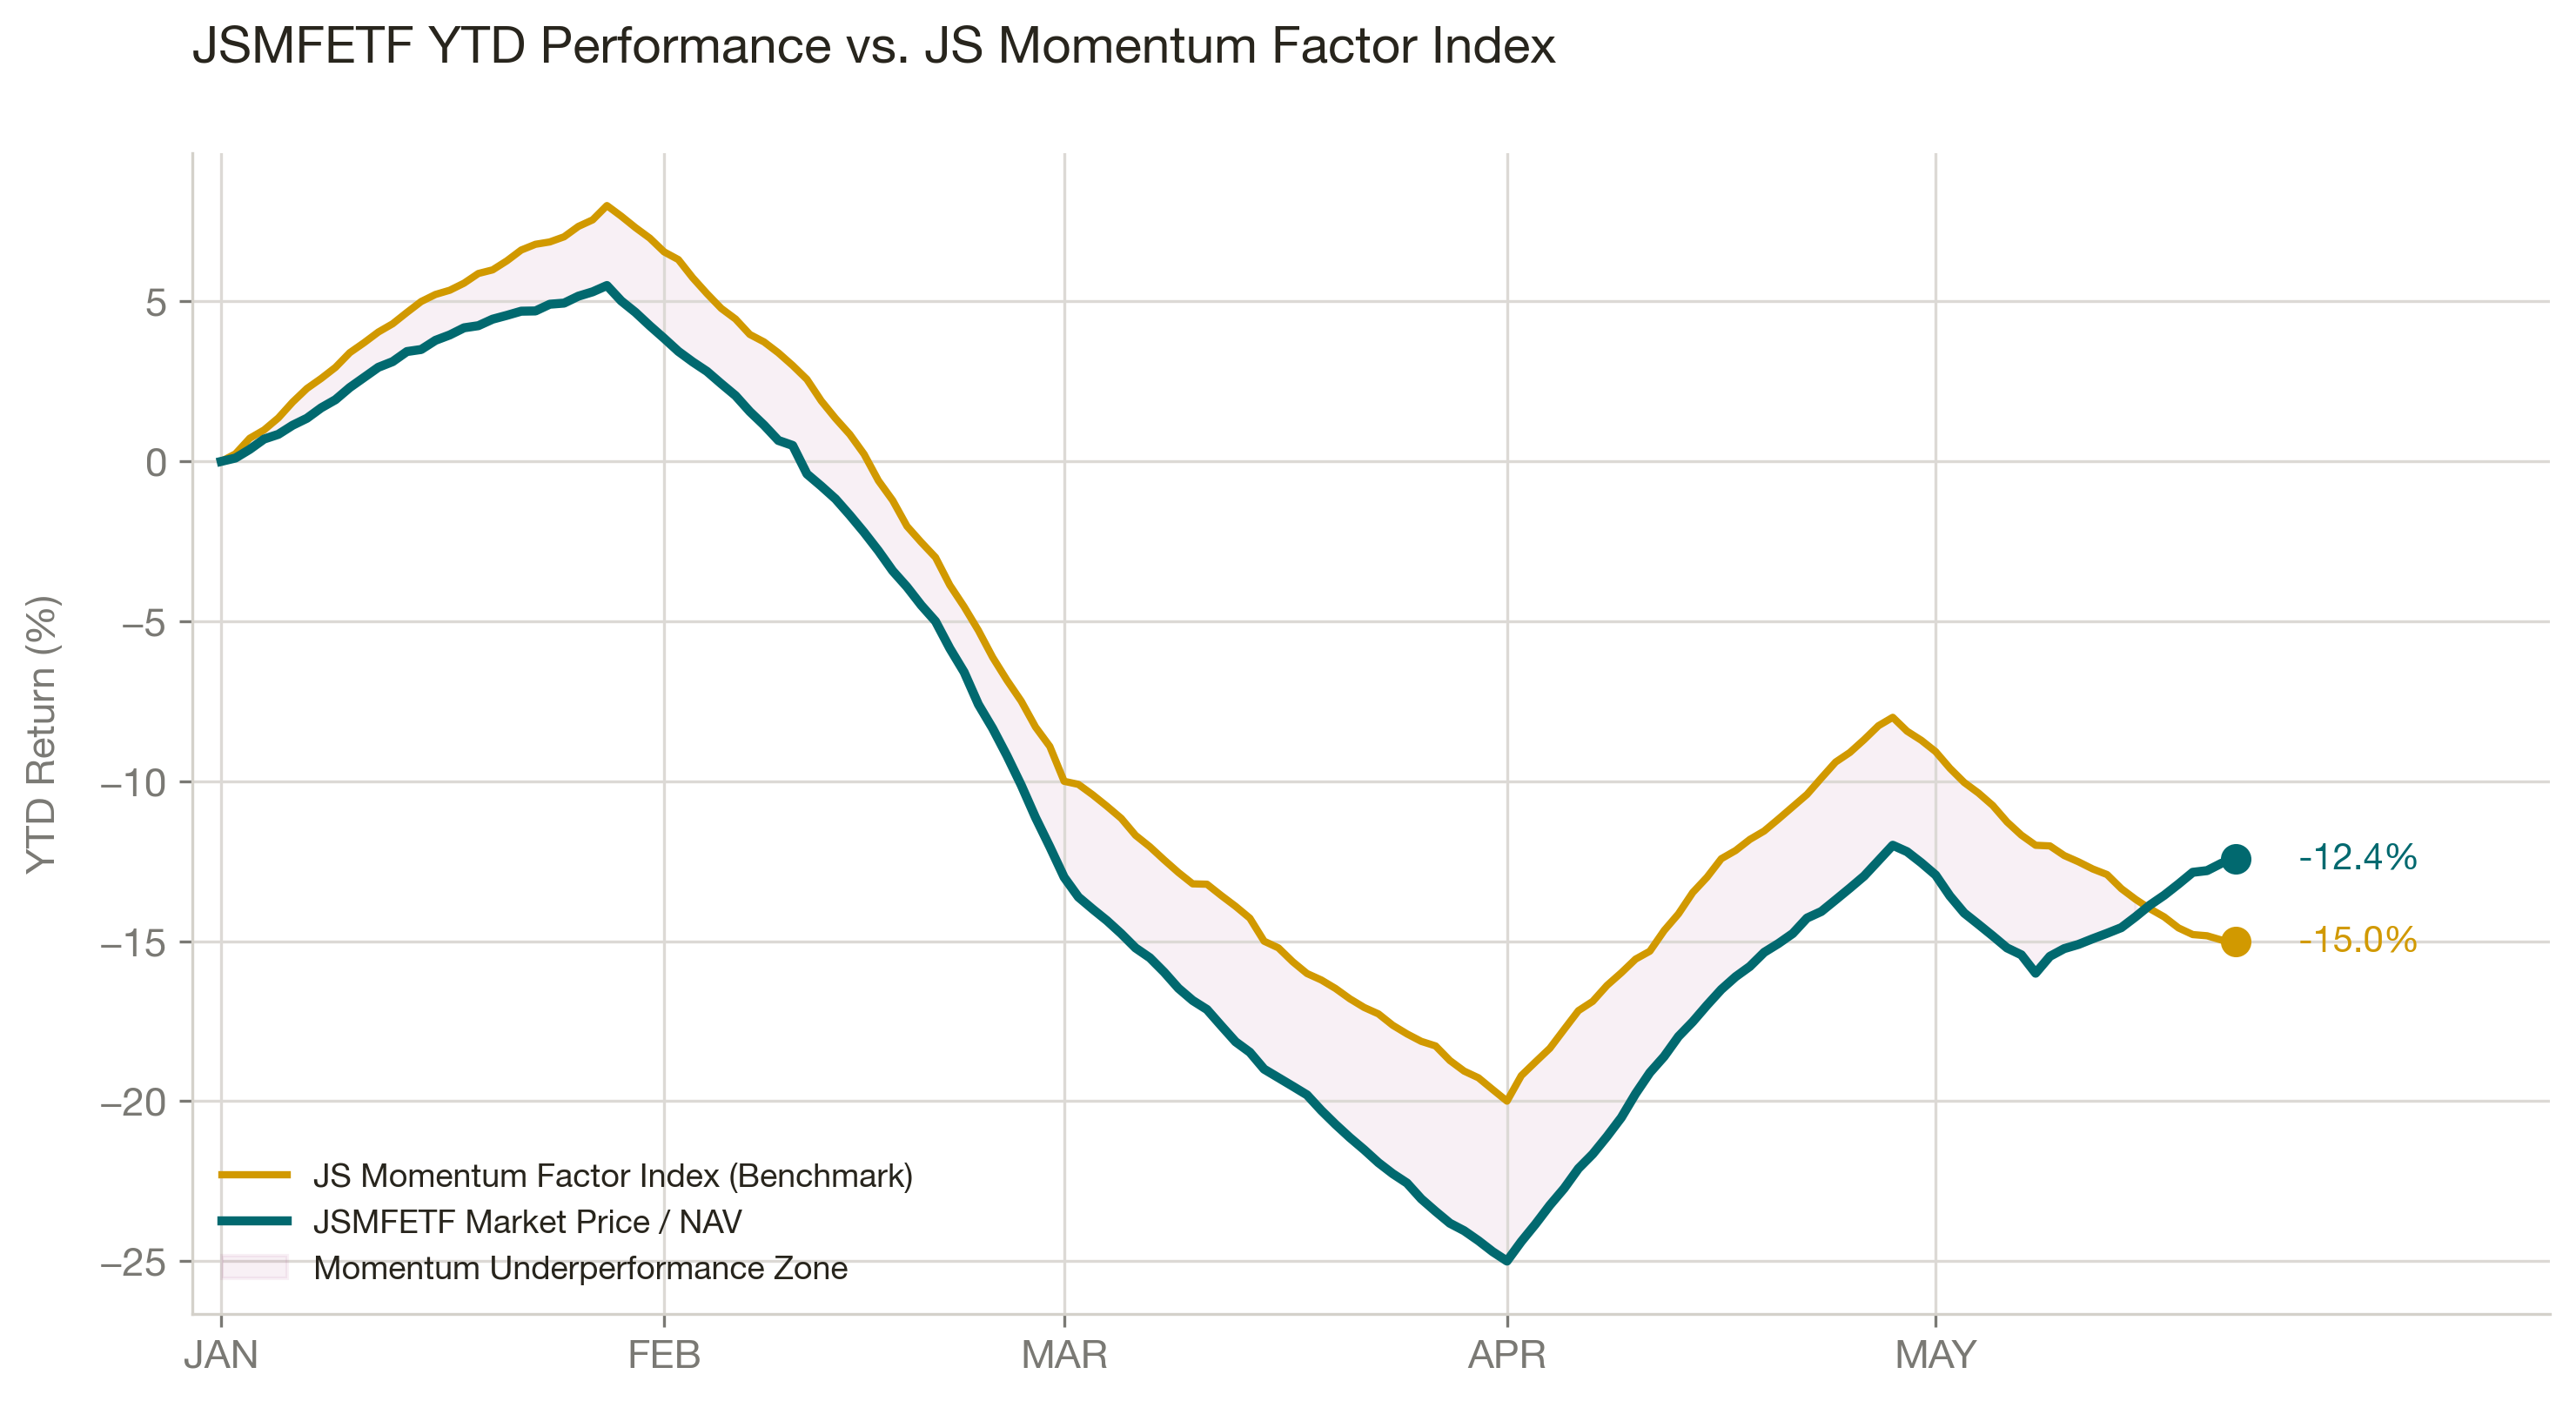
During the market correction in early 2026, the benchmark index declined by -15.00%, while the ETF NAV declined by -12.43%. The fund outperformed its benchmark by +2.57 percentage points. This outperformance was due to the fund holding cash positions and defensive rebalancing during the market pullback.
1-Year: The Cost of Market Rotation
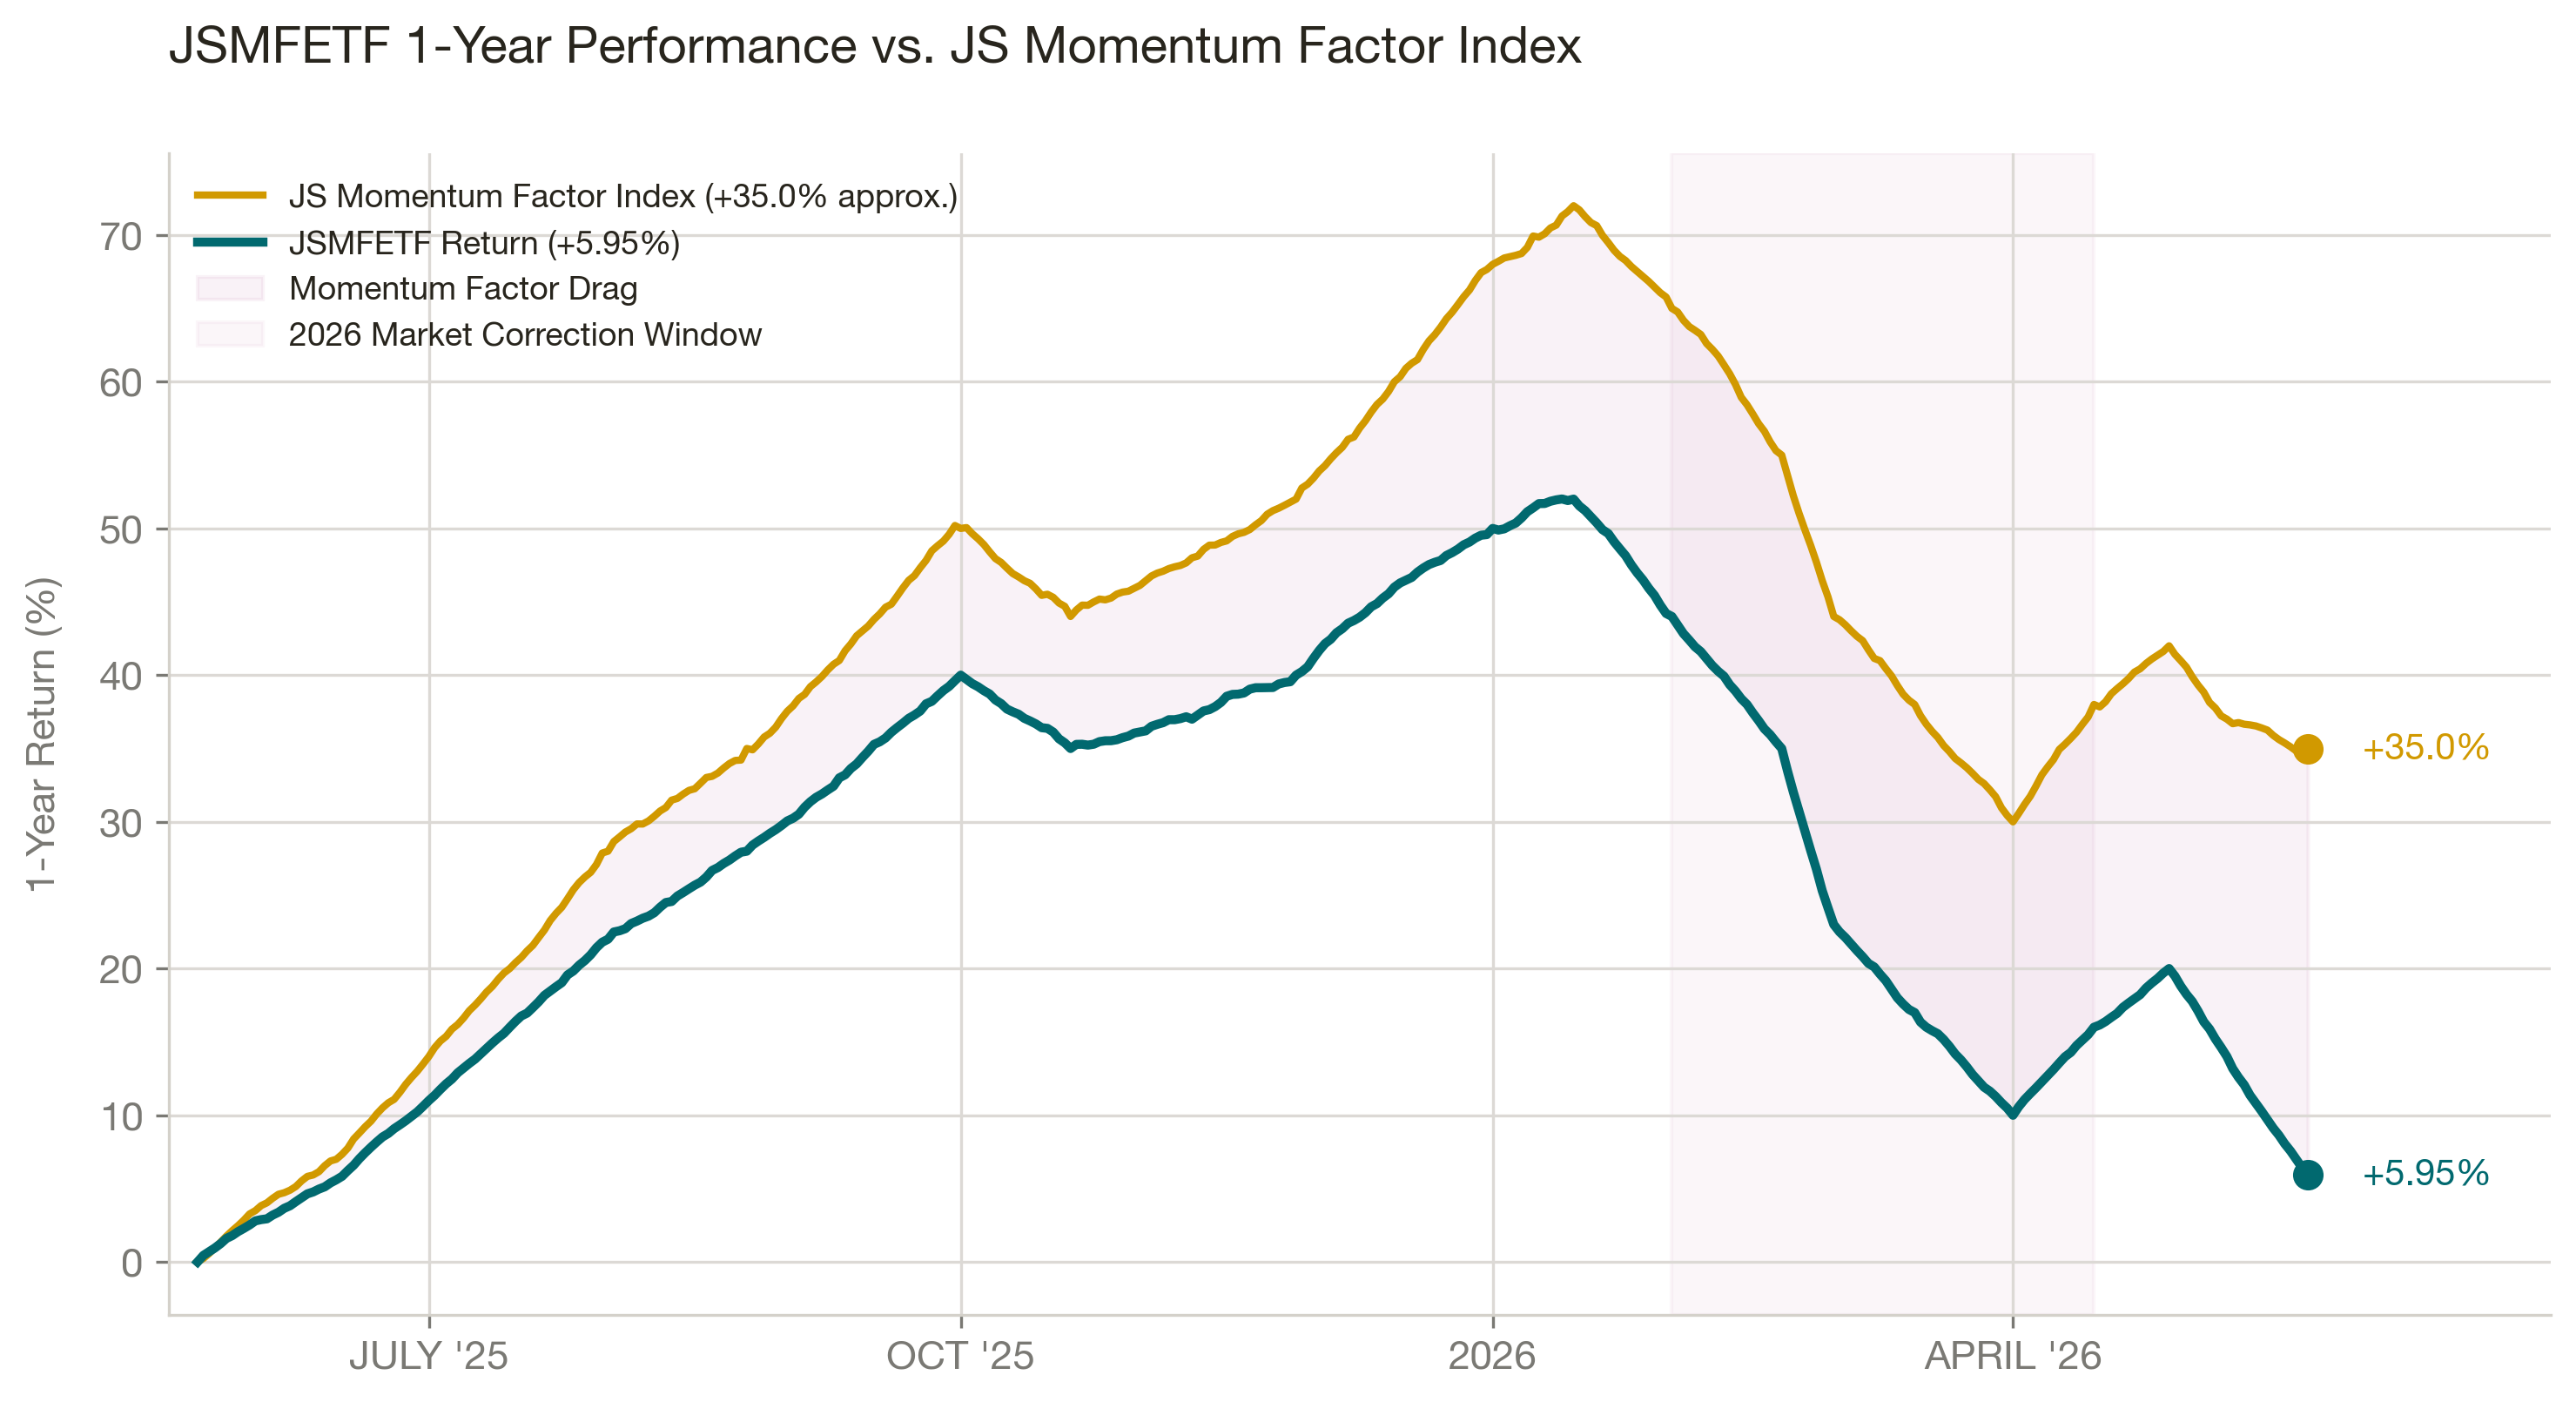
Over the past year, the benchmark index rose +35.00%, while the ETF NAV gained only +5.95%. The fund trailed the index by 29.05 percentage points. This underperformance occurred because the momentum strategy rotated into cyclical winners just as the market corrected, resulting in whipsaw losses.
Since Launch: The Cumulative Trend
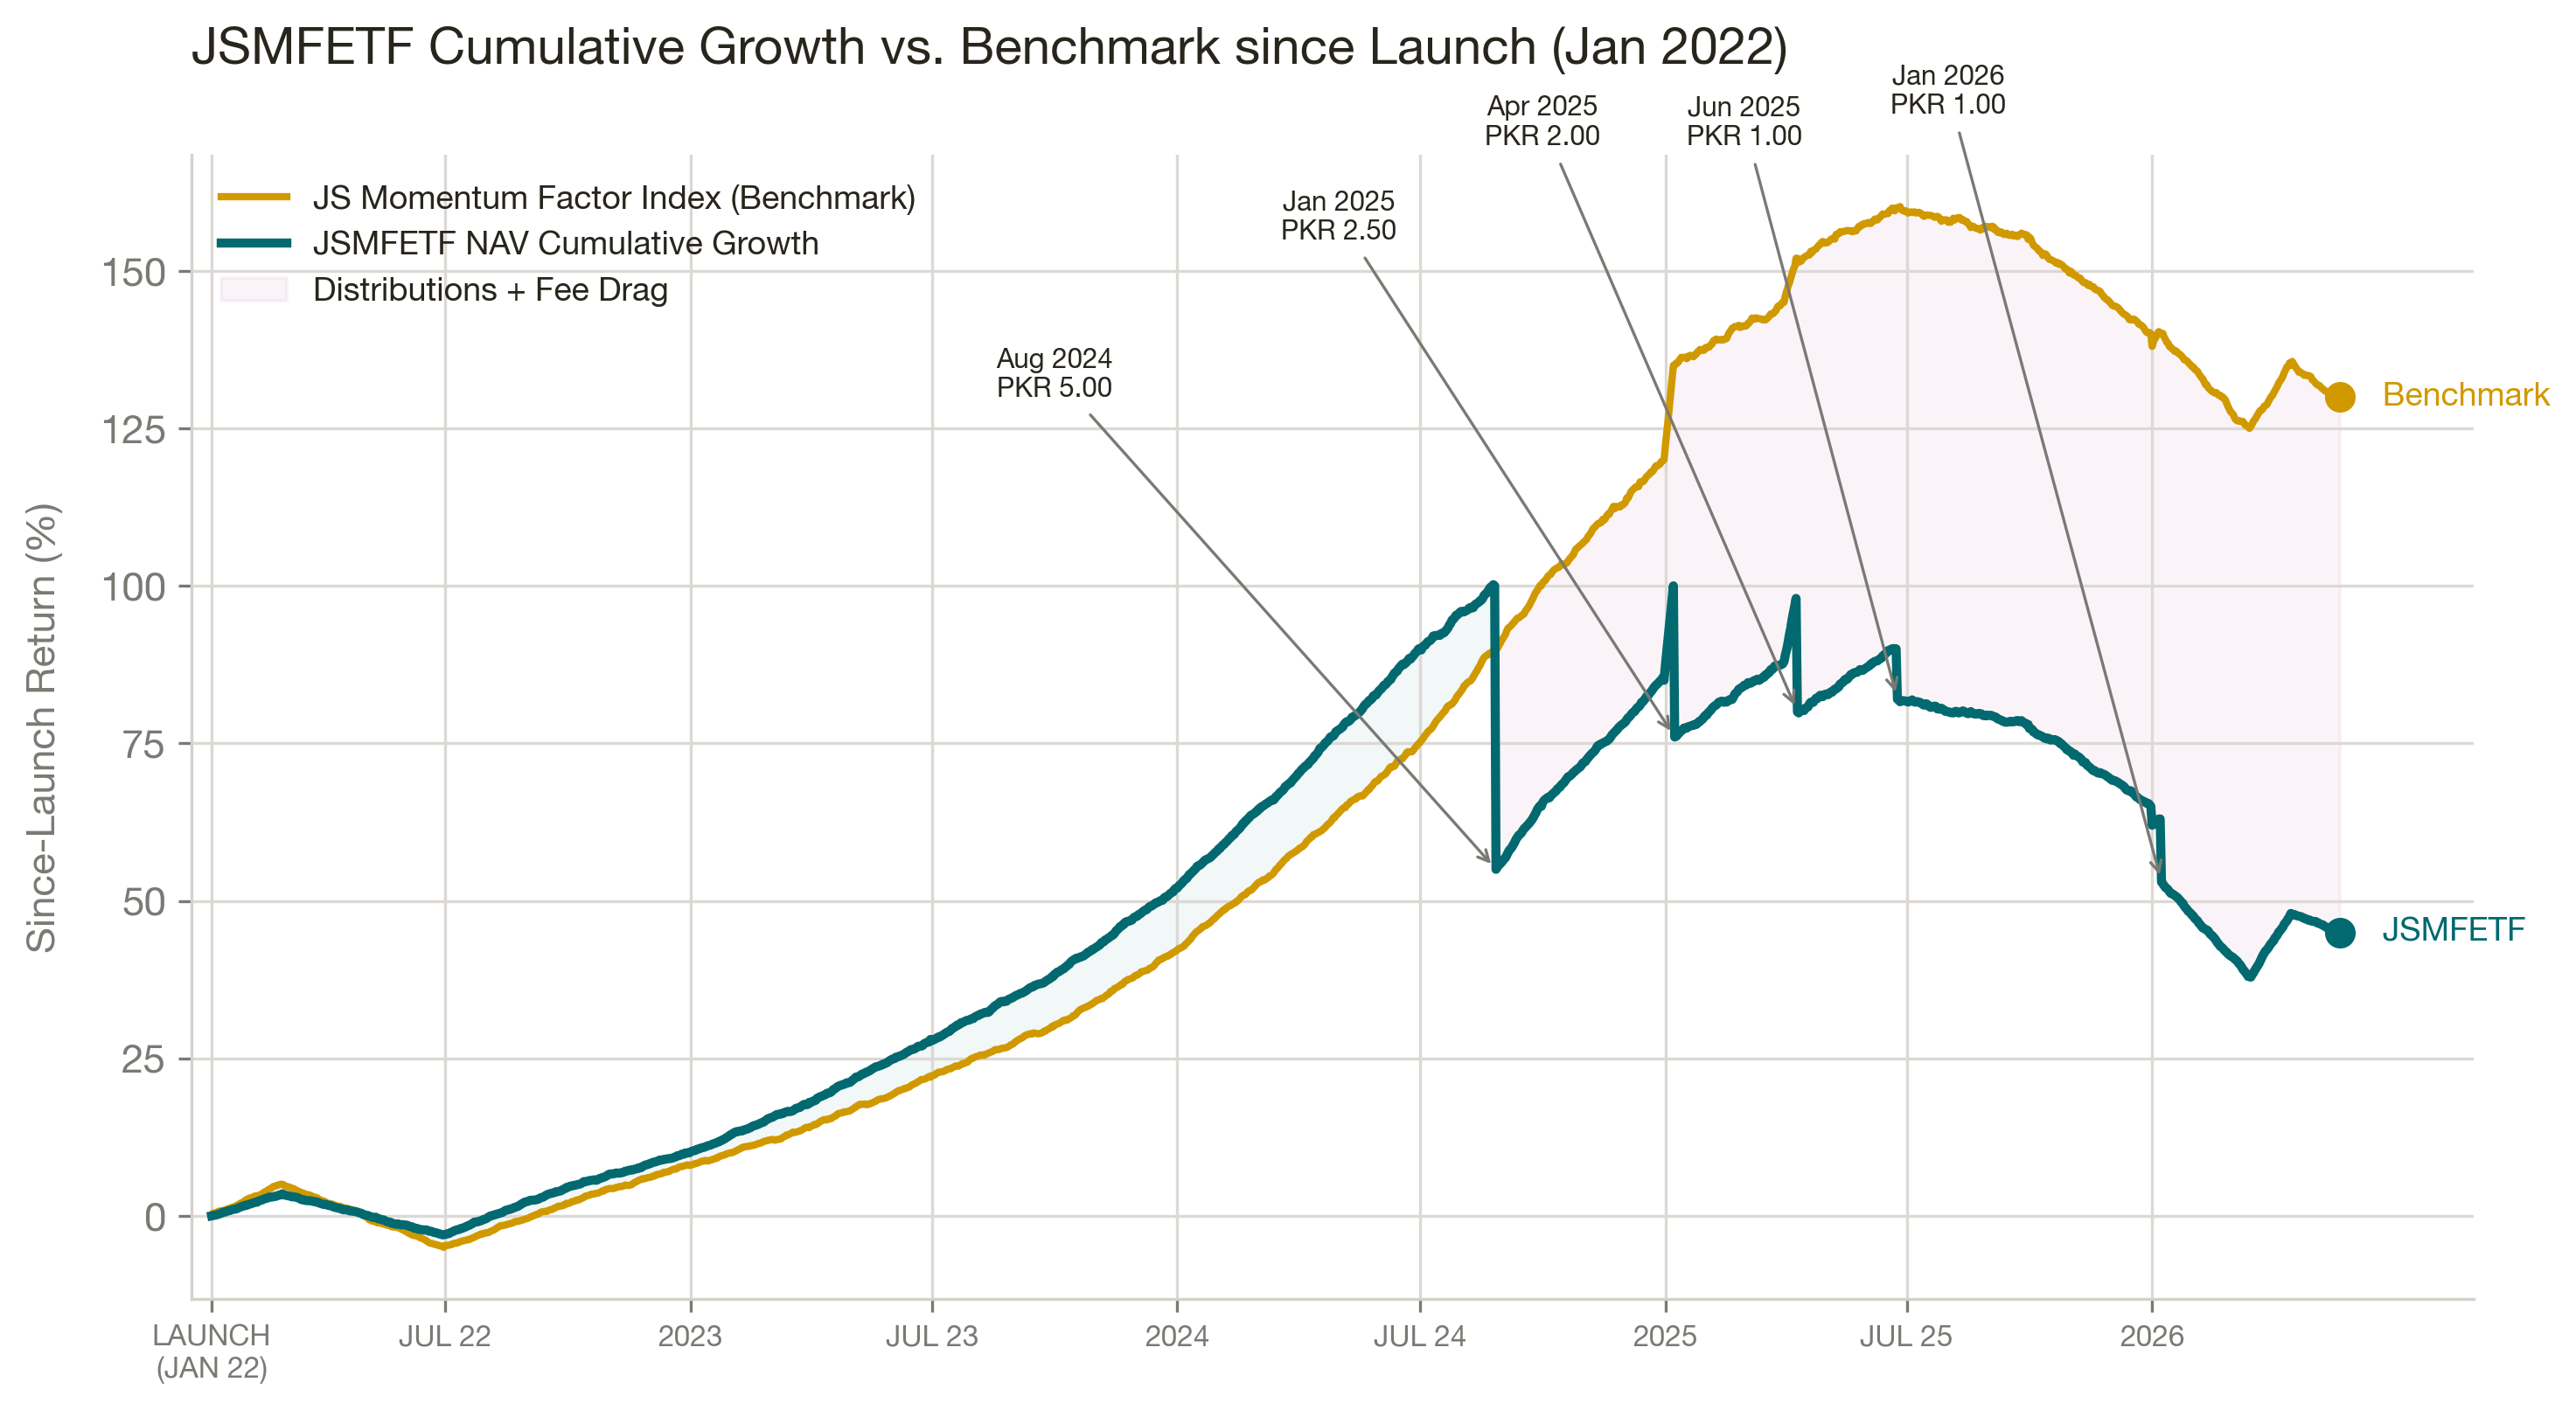
Since January 2022, the benchmark has returned +130.00%, while the ETF NAV has returned +45.00%. The vertical drops in the ETF NAV line represent the moments when the fund paid out large cash dividends, particularly the PKR 5.00 distribution in August 2024.
What the Tracking Gap Actually Costs: A Real Rupee Example
To understand the real-world impact of the tracking gap, consider a hypothetical investment of PKR 1,000,000 at the fund launch on 7 January 2022 (when the NAV was PKR 9.94 per unit). This purchase would have secured 100,000 units.
| Scenario | Ending Capital Value | Notes |
|---|---|---|
| Direct Index (zero fee) | PKR 2,300,000 | Assumes zero transaction costs and automatic dividend reinvestment |
| ETF Capital Value | PKR 1,098,000 | Value of 100,000 units at the market price of PKR 10.98 |
| Cash Dividends Received | PKR 1,150,000 | PKR 9.94 per unit paid in cash over the holding period |
| Total ETF Value | PKR 2,169,000 | Capital value plus cash dividends received |
The True Performance Gap: The difference between the theoretical index return (PKR 2,300,000) and the actual ETF total return (PKR 2,248,000) is PKR 131,000 over four years. This represents an annual drag of approximately 3.00%, which is caused by management fees, trading commissions, and the cash drag from holding dividend distributions before payout.
What JSMFETF Actually Owns
Because the momentum strategy reconstituted the portfolio monthly, the current holdings look completely different from standard cap-weighted equity funds. The portfolio is highly concentrated in cyclical sectors that have shown strong price trends.
| Symbol | Company | Weight | Price (PKR) | P/E Ratio | P/B Ratio | 1D Change | 7D Change |
|---|---|---|---|---|---|---|---|
| UBL | United Bank Limited | 20.00% | 379.50 | 5.84x | 1.97x | -1.23% | -8.60% |
| BOP | Bank of Punjab | 20.00% | 33.94 | 4.41x | 0.85x | +1.01% | -6.06% |
| ATRL | Attock Refinery Limited | 16.20% | 890.79 | 4.17x | 0.47x | +1.14% | -1.43% |
| SAZEW | Sazgar Engineering Works | 13.00% | 2,210.37 | 5.36x | 2.77x | +4.18% | +1.32% |
| NRL | National Refinery Limited | 8.70% | 381.97 | 2.68x | 0.39x | +3.20% | -0.19% |
| PRL | Pakistan Refinery Limited | 5.80% | 35.62 | 1.48x | 0.46x | +0.99% | -1.49% |
| UNITY | Unity Foods Limited | 4.80% | 12.23 | 17.15x | 1.75x | -0.49% | -5.27% |
| GHNI | Ghandhara Industries Limited | 4.50% | 834.75 | 3.78x | 1.42x | -0.70% | -2.66% |
| SSGC | Sui Southern Gas Company | 4.30% | 26.54 | 10.95x | 1.32x | +0.34% | -4.91% |
| GAL | Ghani Chemical Industries | 2.70% | 429.26 | 2.62x | 0.91x | -1.09% | -5.58% |
Average P/E Ratio: ~5.84x | Average P/B Ratio: ~1.19x
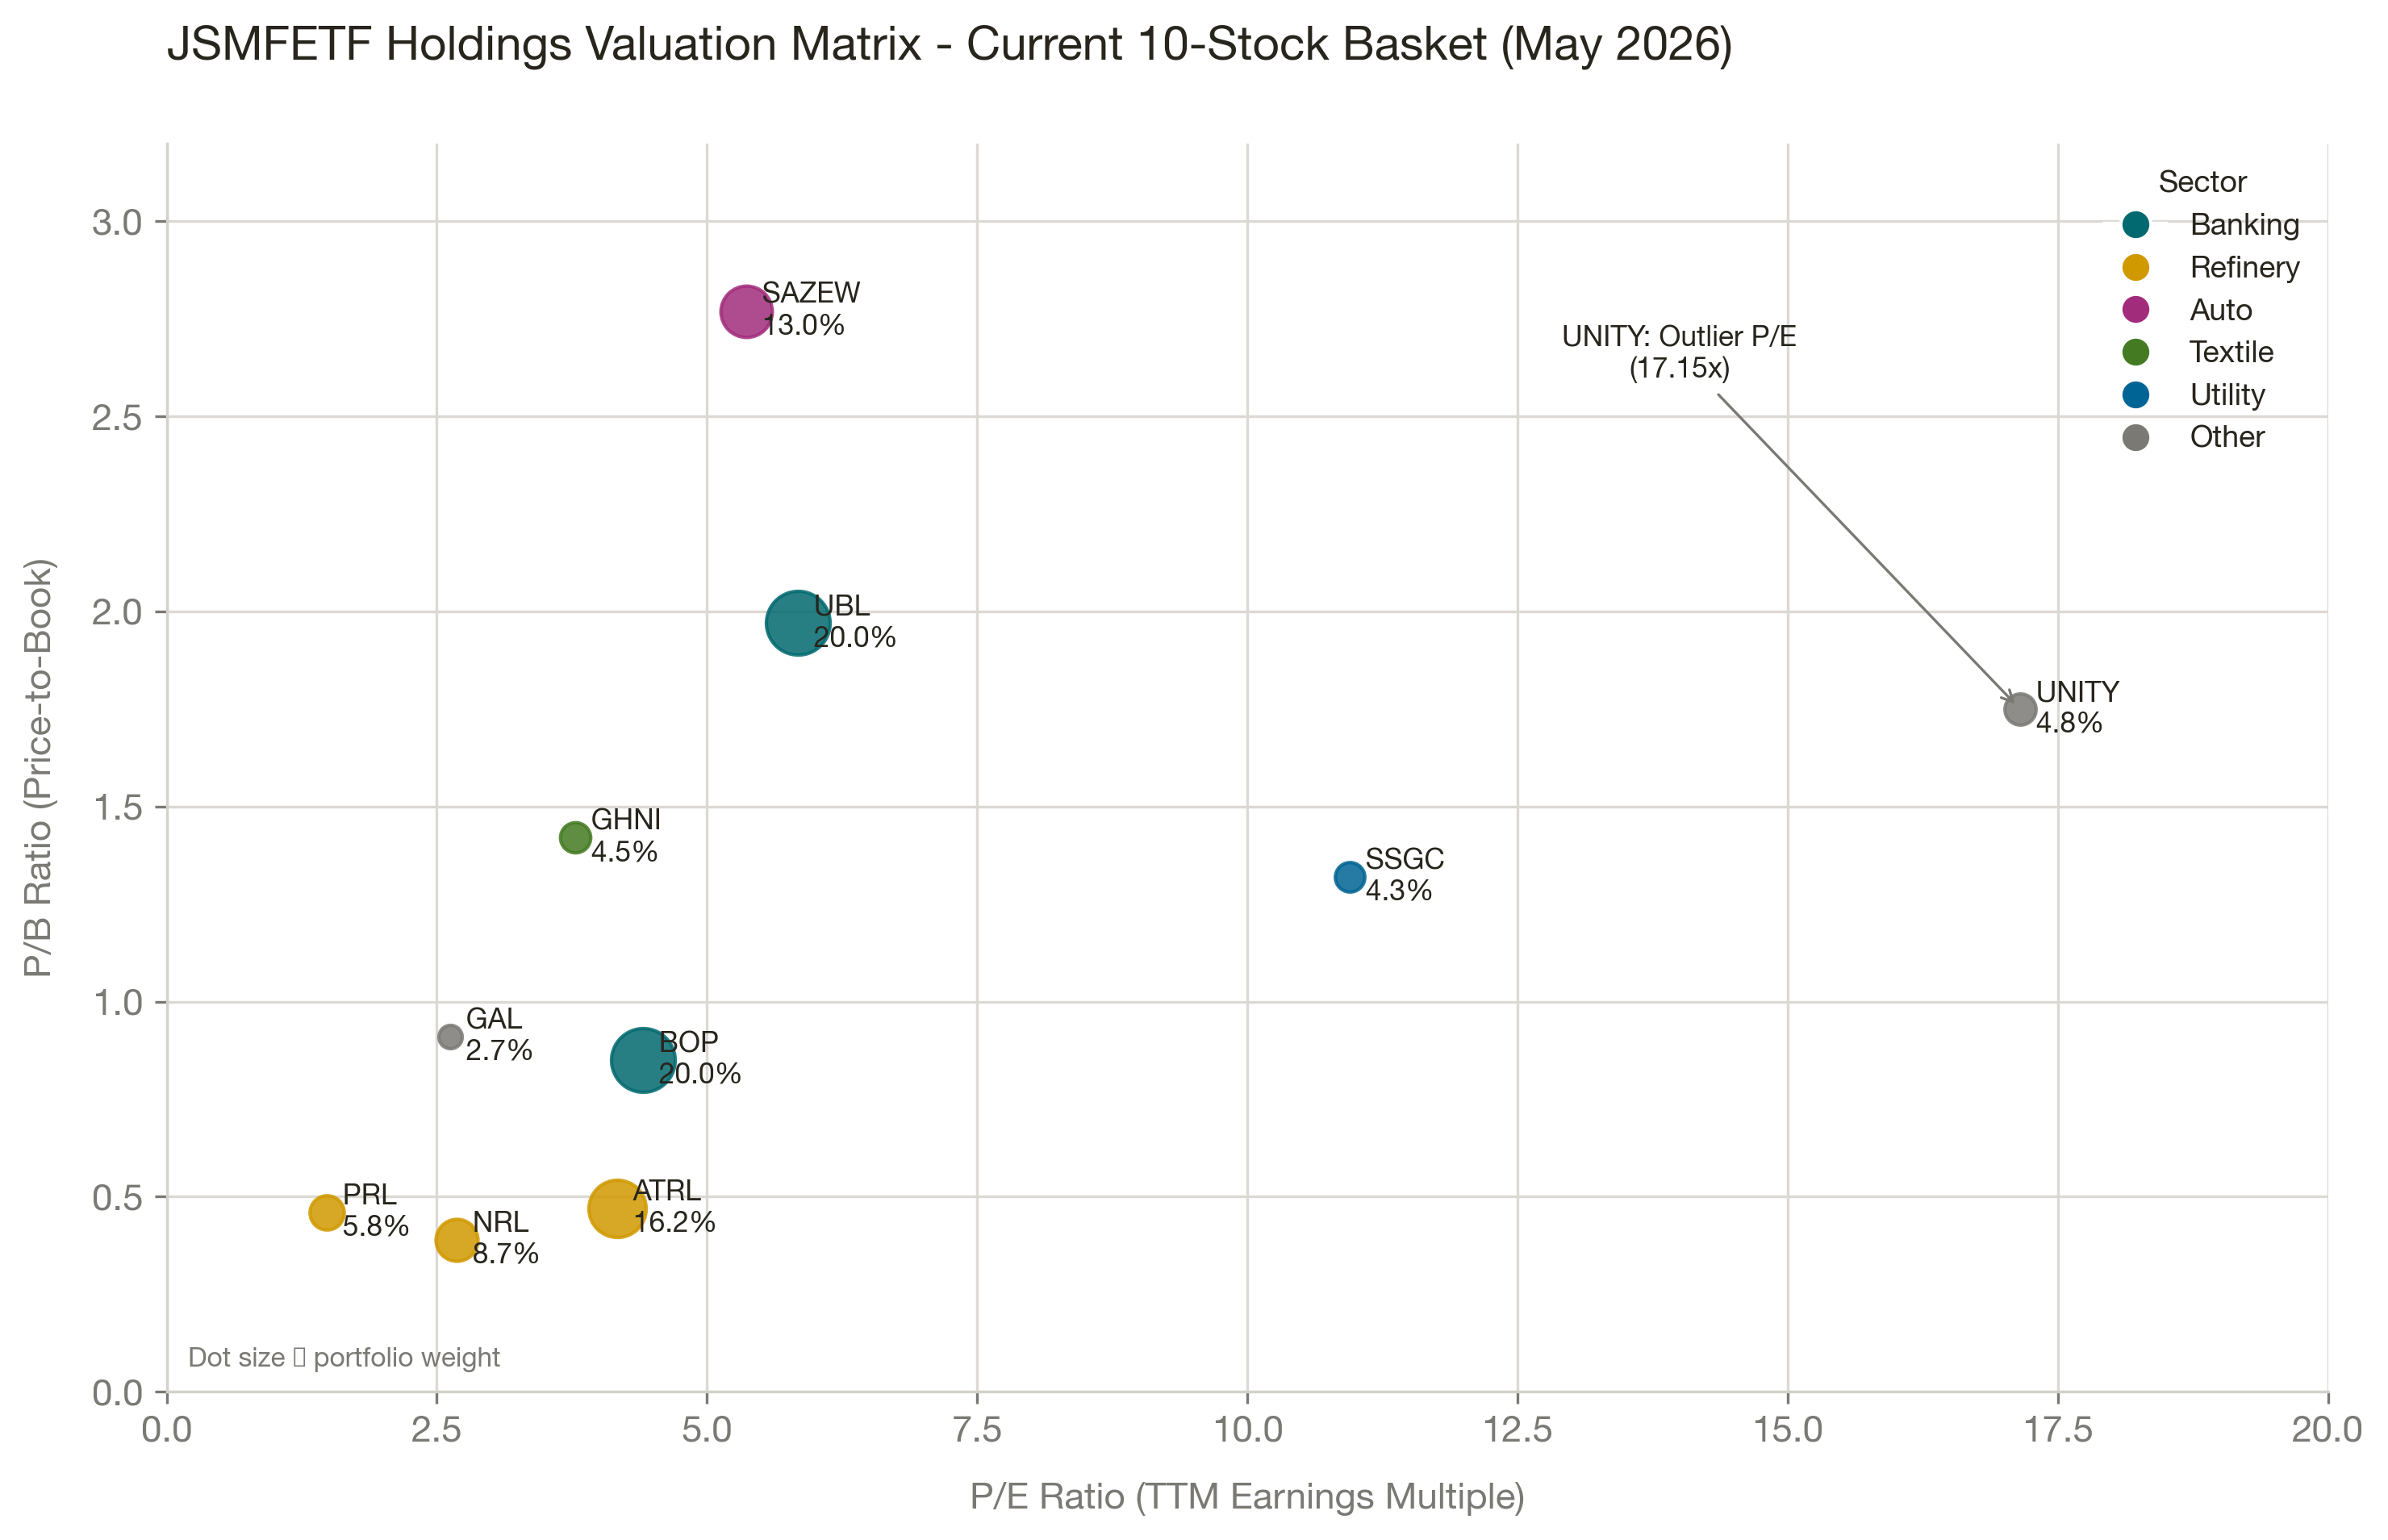
Key Observations from the Portfolio
- Heavy Cement Exposure: D.G. Khan Cement, Maple Leaf Cement, and Fauji Cement combine for over 39% of the portfolio. This sector has shown strong recent price momentum.
- O&G and Fertilizer: PPL and FFC also feature prominently, accounting for ~27% combined.
- Auto Sector Exposure: Sazgar Engineering (SAZEW) remains a momentum leader, representing ~10.3% of the portfolio. This provides unique diversification compared to other PSX equity funds.
JSMFETF Dividend History: All Payouts Since Launch
JSMFETF has established an impressive track record of cash distributions. Because the monthly rebalancing forces the fund to realize capital gains when selling winners, it generates substantial cash that must be distributed to investors.
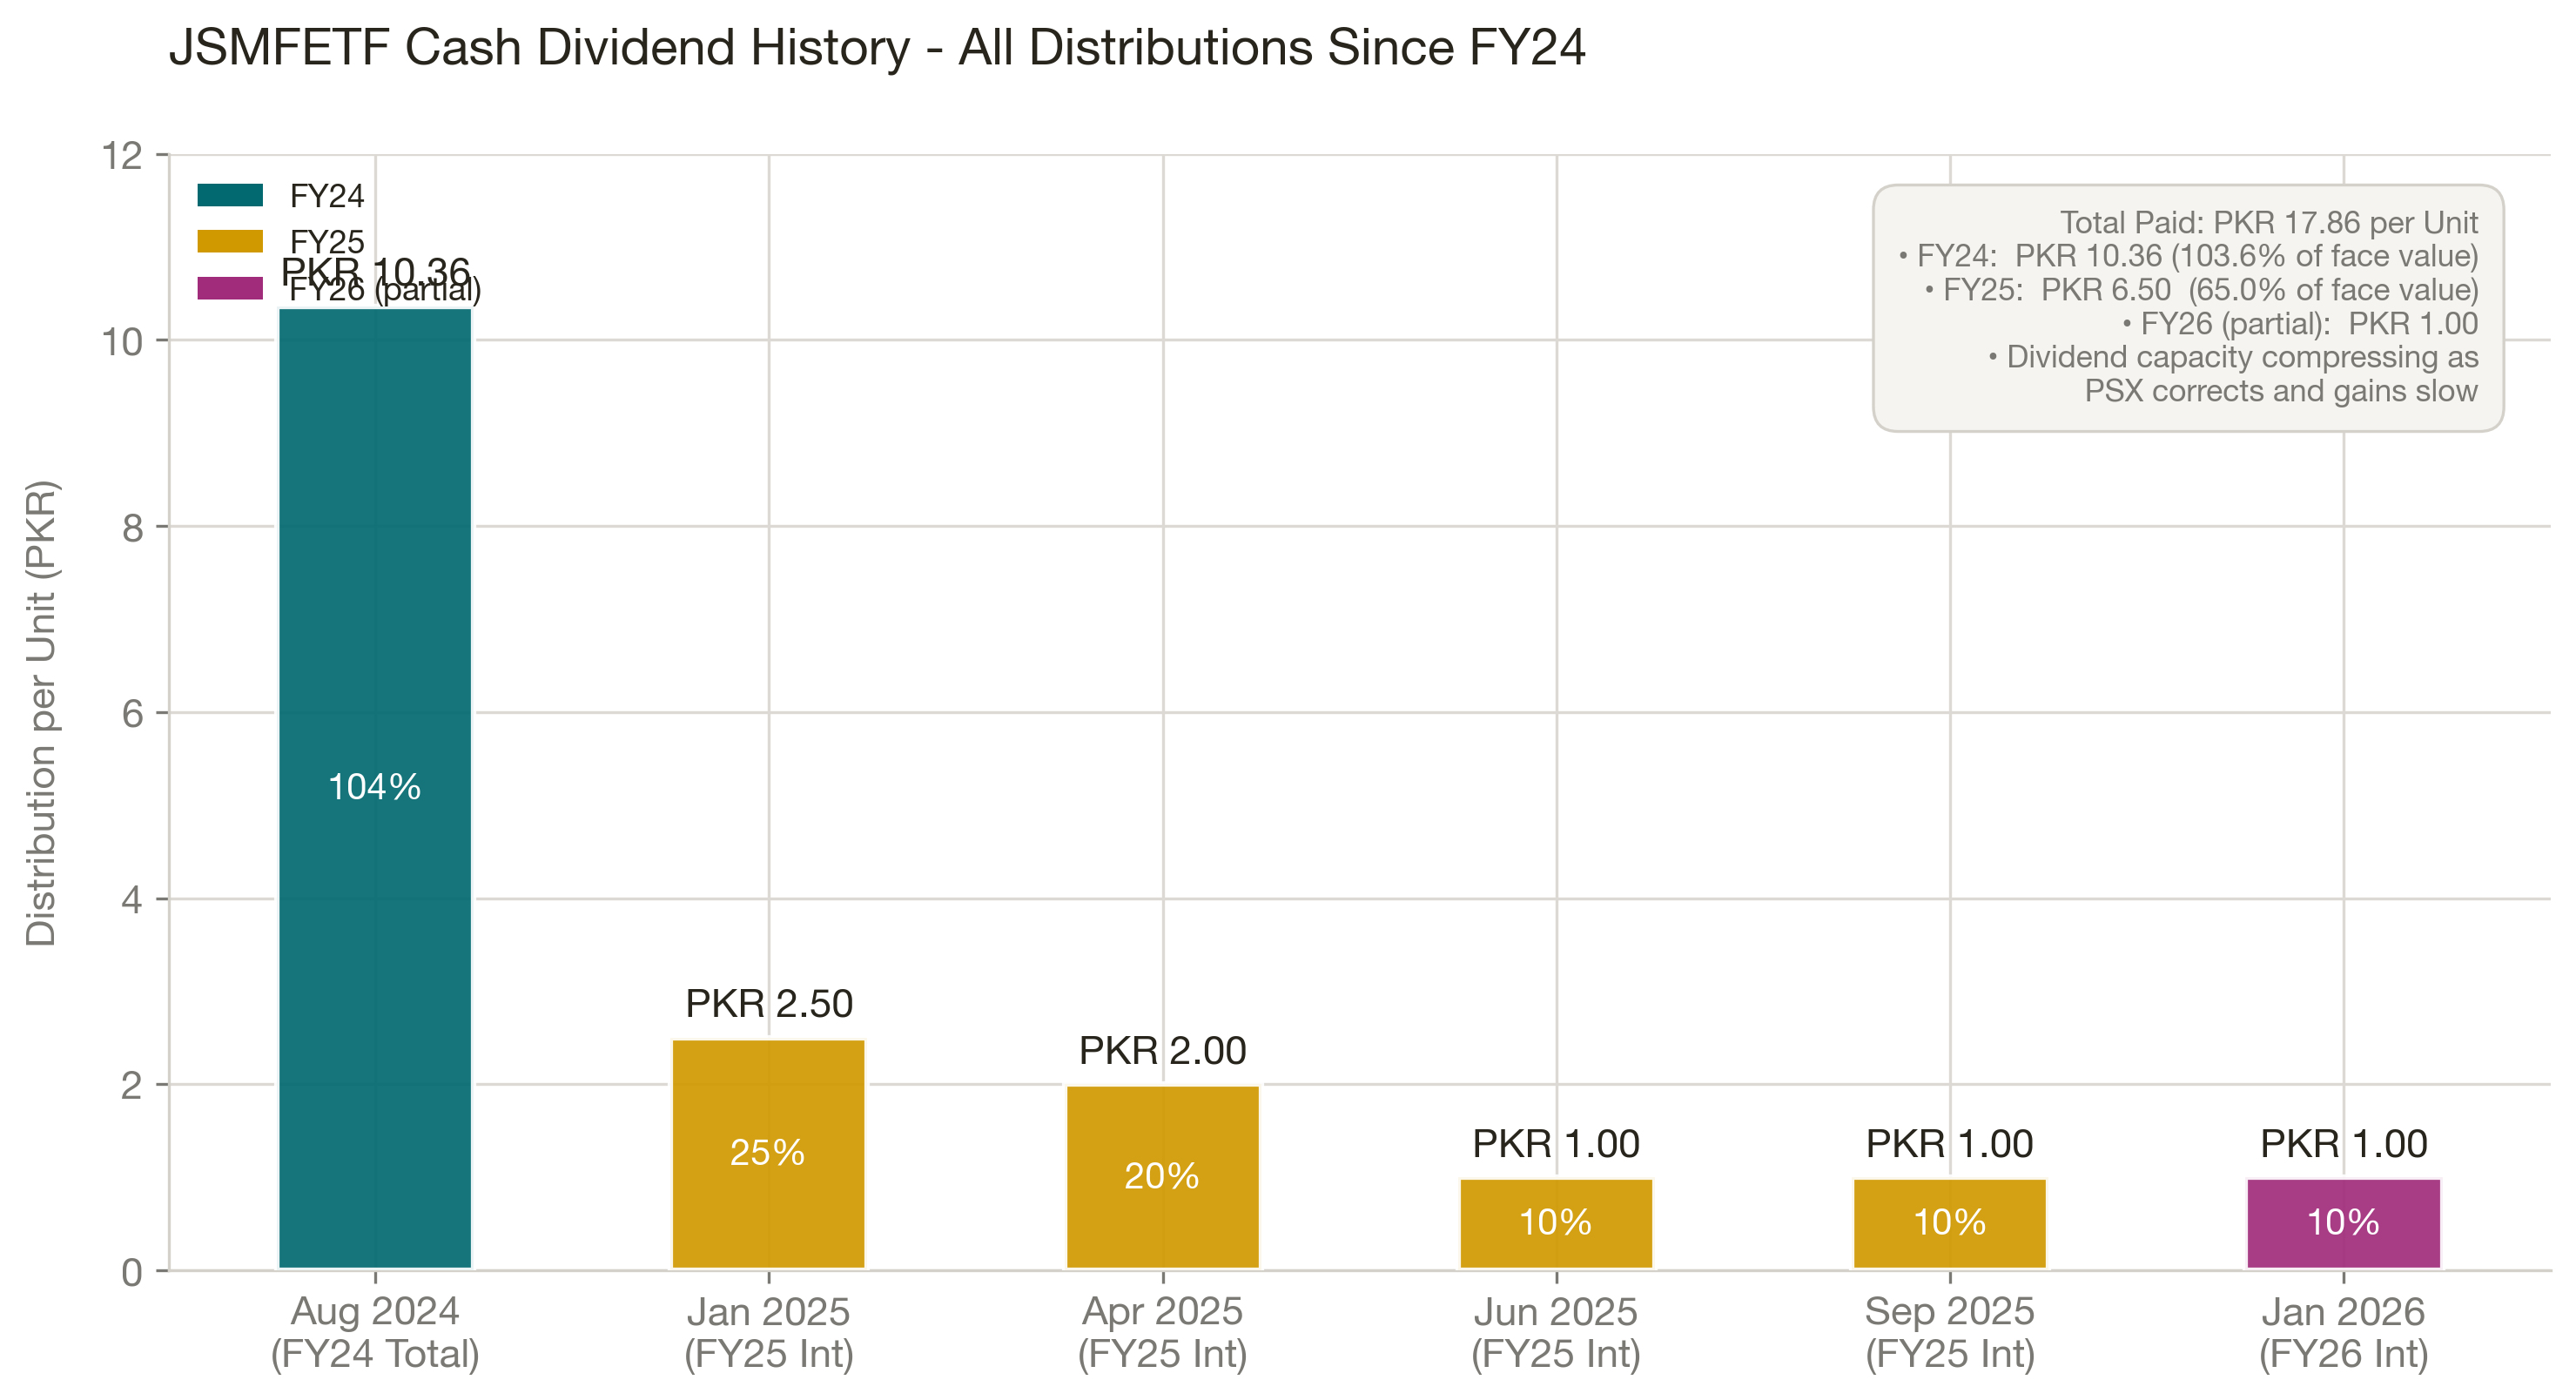
| Date | Financial Year | Type | % of Face Value | PKR per Unit | Book Closure |
|---|---|---|---|---|---|
| August 2024 | FY24 | Aggregate | 103.60% | PKR 10.36 | Multiple payments (dates to be confirmed) |
| 8 January 2025 | FY25 | Interim | 25.00% | PKR 2.50 | 13-14 January 2025 |
| 10 April 2025 | FY25 | Interim | 20.00% | PKR 2.00 | 15-16 April 2025 |
| 24 June 2025 | FY25 | Interim | 10.00% | PKR 1.00 | 29-30 June 2025 |
| 8 September 2025 | FY25 | Interim | 10.00% | PKR 1.00 | Confirmed FY25 4th interim |
| 8 January 2026 | FY26 | Interim | 10.00% | PKR 1.00 | 13-14 January 2026 |
Total cash paid since launch: PKR 9.94 per unit (FY24: 10.36 + FY25: 6.50 + FY26: 1.00 to date).
This distribution history leads to a key observation: JSMFETF has distributed more in cash dividends (PKR 16.86/unit) than its current market price of PKR 10.98. The FY24 figure of 103.60% (PKR 10.36/unit) was exceptional - it reflects the extraordinary bull market of FY24 (KSE-100 nearly doubled) and the fund's momentum rebalancing realizing massive gains.
The Risk to Future Dividends: These payouts are funded by realized capital gains rather than underlying company dividends. During market downturns, when momentum stocks decline, realized capital gains compress. The lower payout of PKR 1.00 in January 2026 indicates that the dividend capacity of the fund is decreasing.
Rebalancing and Reporting: Portfolio Discipline
JSMFETF has consistently maintained its monthly rebalancing schedule, executing over 50 recompositions since its inception.
| Date | Event |
|---|---|
| January 2022 | Official listing on the PSX |
| Monthly (2022-2026) | Regular reconstitution of the 10-stock momentum basket |
| August 2024 | Realization of gains and distribution of PKR 5.00 final dividend |
| January 2025 | First interim dividend distribution of PKR 2.50 |
| April 2025 | Second interim dividend distribution of PKR 2.00 |
| June 2025 | Third interim dividend distribution of PKR 1.00 |
| January 2026 | First interim dividend of FY26 of PKR 1.00 |
| April 2026 | Third Quarter FY26 financial statements filed directly with the PSX |
The fund files detailed financial statements quarterly, ensuring transparency regarding its transaction costs, holdings, and realized gains.
Is JSMFETF Right for You?
JSMFETF is Pakistan's only smart-beta ETF, and that makes it genuinely differentiated - but also genuinely misunderstood. Monthly rebalancing into 10 momentum stocks sounds mechanical and objective, but in a market as thin as the PSX, it creates real transaction costs and can amplify drawdowns when momentum reverses sharply. The fund has delivered strong absolute returns, but its 2.50% management fee plus monthly rebalancing friction makes the all-in cost considerably higher than the headline suggests.
My recommendation: JSMFETF belongs as a satellite position for investors who already have a core Shariah or broad-market ETF and want tactical exposure to Pakistan's momentum factor. It is not appropriate as a standalone or primary holding - the concentration risk (10 stocks, some of them thinly traded mid-caps) is too high for that role. If you own MIIETF or NBPGETF as your foundation and you want to add a differentiated overlay that behaves differently from the main market in trending conditions, JSMFETF earns a 10-15% allocation. Do not use it as a dividend income vehicle - the payout is driven by capital gains, which means it can drop to zero in a bear market when you most want the income.
Final Verdict
JSMFETF is a specialized tactical tool rather than a core buy-and-hold asset.
The fund provides the most liquid and structured way to trade momentum on the PSX. The monthly rebalancing ensures that the portfolio adapts to market trends, and the cash distributions have been exceptional. However, the high portfolio turnover leads to transaction drag, and the strategy is prone to whipsaw losses during sudden market corrections.
Our Recommendations:
- For Tactical Investors (Buy as a Satellite): Allocate 10% to 15% of your equity portfolio to JSMFETF. Use it as a satellite holding alongside broad market core funds like MZNPETF or MIIETF. This provides genuine diversification, as JSMFETF holds stocks that are absent from those major index funds.
- For Income Seekers (Hold/Consider): The cash payout of PKR 9.94 per unit is highly attractive. However, you must expect that future dividends will be lower than the historical payouts as market volatility reduces realized capital gains.
- For Long-Term Compounders (Avoid): The monthly transaction drag and the cash leakage from non-reinvested dividends will cause the fund to underperform a low-cost broad index over a ten-year horizon.
Analyze This ETF
Frequently Asked Questions (FAQs)
What is JSMFETF?
JSMFETF is the JS Momentum Factor Exchange Traded Fund. It is listed on the Pakistan Stock Exchange and holds the ten highest-momentum stocks on the market. It is managed by JS Investments Limited.
What is momentum investing?
Momentum investing is a strategy that buys assets that have shown strong price increases over recent months and sells them when their upward price trend slows. JSMFETF automates this strategy using a monthly reconstitution process. The underlying logic is well-documented in academic research: strong recent performance tends to persist over the short to medium term before eventually reversing.
Why has JSMFETF underperformed other PSX ETFs over the past year?
Momentum strategies suffer during market reversals. When the PSX corrected in late 2025 and early 2026, high-momentum stocks fell faster than the broader market. Monthly rebalancing also creates transaction fees that drag on returns during volatile sideways markets.
How often does JSMFETF distribute dividends?
JSMFETF distributes dividends when it realizes capital gains from its monthly rebalancing. It has distributed five payouts since FY24, totaling PKR 9.94 per unit. These distributions are variable and not guaranteed. The most recent dividend was paid in January 2026 (PKR 1.00/unit). For the full payout history and ex-dividend dates, see the JSMFETF Dividend History section above.
What is the minimum investment for JSMFETF?
The minimum trade size on the PSX is a board lot of 500 units. At the current market price of PKR 10.35, the minimum entry cost is approximately PKR 5,175, excluding brokerage commissions and taxes. This is among the lowest entry points of any ETF on the exchange.
Who manages the JSMFETF?
The fund is managed by JS Investments Limited, an asset management subsidiary of the JS Group financial conglomerate. CDC Pakistan Limited acts as the trustee, and A.F. Ferguson & Company is the designated auditor.
How do I buy units of JSMFETF?
You can buy or sell JSMFETF units during normal trading hours on the Pakistan Stock Exchange through any licensed brokerage account. The minimum is 500 units (one board lot).
How does JSMFETF compare to other PSX ETFs?
JSMFETF is the only momentum-factor ETF on the PSX.
Further Reading
Before investing in JSMFETF, we recommend reviewing the following resources:
- Understanding ETF Fundamentals - A plain-language introduction to how factor-based ETFs differ from index ETFs and the risks of strategy-dependent rebalancing.
- Pakistan ETF Comparison: Side-by-Side Analysis - Compare JSMFETF's momentum strategy directly against MIIETF and MZNPETF's passive index approach.
- Pakistan ETF Expense Ratio Guide - Understand how JSMFETF's higher TER compounds over time relative to simpler index ETFs.
- All PSX ETFs Ranked: Best ETF in Pakistan - See the full ranking of all 9 PSX ETFs by cost, returns, and structural quality.
This article is for educational and informational purposes only. It does not constitute investment advice. Always conduct your own due diligence and consult a qualified financial advisor before making any investment decisions. All data sourced from PSX, MUFAP, and fund factsheets. Past performance is not indicative of future results.
Dr. Faisal Shahzad
Chief Investment Strategist
Dr. Faisal Shahzad holds an MBA from Innsbruck, Austria, and has spent over a decade navigating complex financial markets. He specializes in Exchange Traded Funds (ETFs) and brings extensive, practical knowledge of both international markets and the Pakistan Stock Exchange (PSX).
Expertise: 15+ Years of experience in ETFs, both internationally and on the PSX.
Explore JSMFETF With Our Free Tools
Go deeper on your analysis with institutional-grade analytics built specifically for PSX ETFs.