Key Takeaway: NITGETF is a government-backed index ETF with a low management fee of 0.40%. It tracks a market-cap index of 13 large companies, offering a highly cost-effective way to buy the core PSX market.
The NIT Pakistan Gateway Exchange Traded Fund (NITGETF) is not just another equity fund. It is Pakistan's first-ever exchange-traded fund, listed on the Pakistan Stock Exchange (PSX) under the trading symbol NITG-ETF.
Managed by the National Investment Trust Limited (NIT)-the country's oldest and largest government-sponsored asset manager-it holds the giants of the KSE-100 index in a single, intraday-tradable instrument.
As of 2026-08-11, NITGETF trades at PKR 35.15 per unit, at a +0.29% to iNAV to its live intraday indicative Net Asset Value (iNAV) of PKR 33.78. The fund manages PKR 235.5 million in assets under management (AUM). Its 52-week range of PKR 25.61 to PKR 44.00 highlights the high-beta volatility of the Pakistani equity market.
This independent, data-driven review cuts through the marketing to reveal exactly what you own, how much you lose to tracking error, and whether NITGETF deserves a core place in your portfolio in 2026.
What is NITGETF?
NITGETF is an open-ended, passive equity ETF designed to track the NIT Pakistan Gateway Index (NIT-PGI).
The index uses a simple, robust mandate: select the largest companies from the KSE-100 index by market capitalization such that the selected stocks collectively represent at least 50% of the total free-float market capitalization of the entire KSE-100 index.
The fund is managed by National Investment Trust Limited (NIT), established in 1962 as Pakistan's oldest government-sponsored asset management company. The trustee is Central Depository Company of Pakistan (CDC) and the auditor is Yousuf Adil Chartered Accountants. The fiscal year runs from July 1 to June 30.
What makes NITGETF structurally distinct?
- Broad-Market Representation: By targeting a 50% free-float market cap threshold, NITGETF is the closest vehicle on the PSX to a true, traditional market-cap-weighted index fund.
- Institutional Foundation: Managed under NIT's institutional framework, the fund accommodates large institutional creation unit baskets (with a massive PKR 43,852.28 cash component per basket, by far the largest in the dataset).
- Unmatched Cost Efficiency: At 0.40% per annum, NITGETF charges the lowest base management fee of any equity ETF in Pakistan.
Key Metrics (As of 2026-10-18)
| Metric | Value | Context |
|---|---|---|
| Full Name | NIT Pakistan Gateway Exchange Traded Fund | Pakistan's first ever listed ETF |
| Trading Ticker | NITG-ETF | Listed on the Pakistan Stock Exchange |
| Sarmaaya Ticker | NITGETF | Also referenced as NITGETF |
| Fund Manager | National Investment Trust Limited (NIT) | Oldest government-sponsored AMC in Pakistan |
| Benchmark | NIT Pakistan Gateway Index (NIT-PGI) | Custom blue-chip market cap benchmark |
| AUM | PKR 211.8 million | Liquid institutional-grade asset size |
| Market Price | PKR 35.15 per unit | As of 2026-08-11 (+0.29% to iNAV) |
| iNAV | PKR 35.05 per unit | Live iNAV as of 2026-08-11 |
| Refreshed live every 15 seconds during trading | ||
| PSX Ticker Page | NITG-ETF on PSX | View live intraday NAV, market price, and trading volumes |
| 52-Week Range | PKR 25.61 - PKR 44.00 | Highlights the 2024-2025 cycle |
| Management Fee | 0.40% per annum | The lowest management fee on the PSX |
| Constituents | 13 Blue-Chips | Giants representing ≥50% KSE-100 free-float |
| Rebalancing | Quarterly + Extraordinary | Quarterly adjustments with special triggers |
The 0.40% management fee is a major structural benefit. In a market where peers charge up to 1.50% to 2.50% for passive baskets, NIT's low expense base protects long-term compounding returns.
Performance vs Benchmark: The Real Story
Unlike many other PSX ETF operators, NIT provides full transparency by publishing its long-term financial performance against its benchmark index:
Annual Performance Record
| Financial Year | NITGETF NAV Return | Benchmark Return | Tracking Gap |
|---|---|---|---|
| FY21 | +19.71% | +24.10% | -4.39% |
| FY22 | -12.56% | -11.00% | -1.56% |
| FY23 | +9.55% | +10.85% | -1.30% |
| FY24 | +93.40% | +100.88% | -7.48% |
Annual audited returns. Source: National Investment Trust Limited.
The -7.48% tracking gap in FY24 was the largest since the fund's listing. This gap highlights a common ETF challenge: during explosive bull markets, cash drag, quarterly rebalancing lag, and real-world transaction friction (e.g., brokerage commissions, bid-ask spreads) cause the actual fund to trail its frictionless, zero-cost theoretical index.
Short-Term Returns (As of 2026-07-27)
| Period | Market Price Return | NAV Return | Benchmark Return | Tracking Gap |
|---|---|---|---|---|
| 1 Week | -1.09% | -1.84% | -1.75% | -0.09% |
| 1 Month | -1.25% | -2.48% | -2.35% | -0.13% |
| 3 Months | -4.68% | -4.73% | -4.50% | -0.23% |
| 6 Months | +5.95% | +5.65% | +6.05% | -0.40% |
| 1 Year | +40.27% | +39.95% | +43.20% | -3.25% |
Data as of 2026-07-27. Past performance is not a guarantee of future results.
NAV vs Benchmark: Two Charts, One Story
These two charts show how NITGETF's NAV has performed against its benchmark. The teal line is the ETF NAV. The gold line is the index. The gap between them is what you give up by owning the fund instead of the index directly.
Cumulative Performance: The Inception to Date Ride
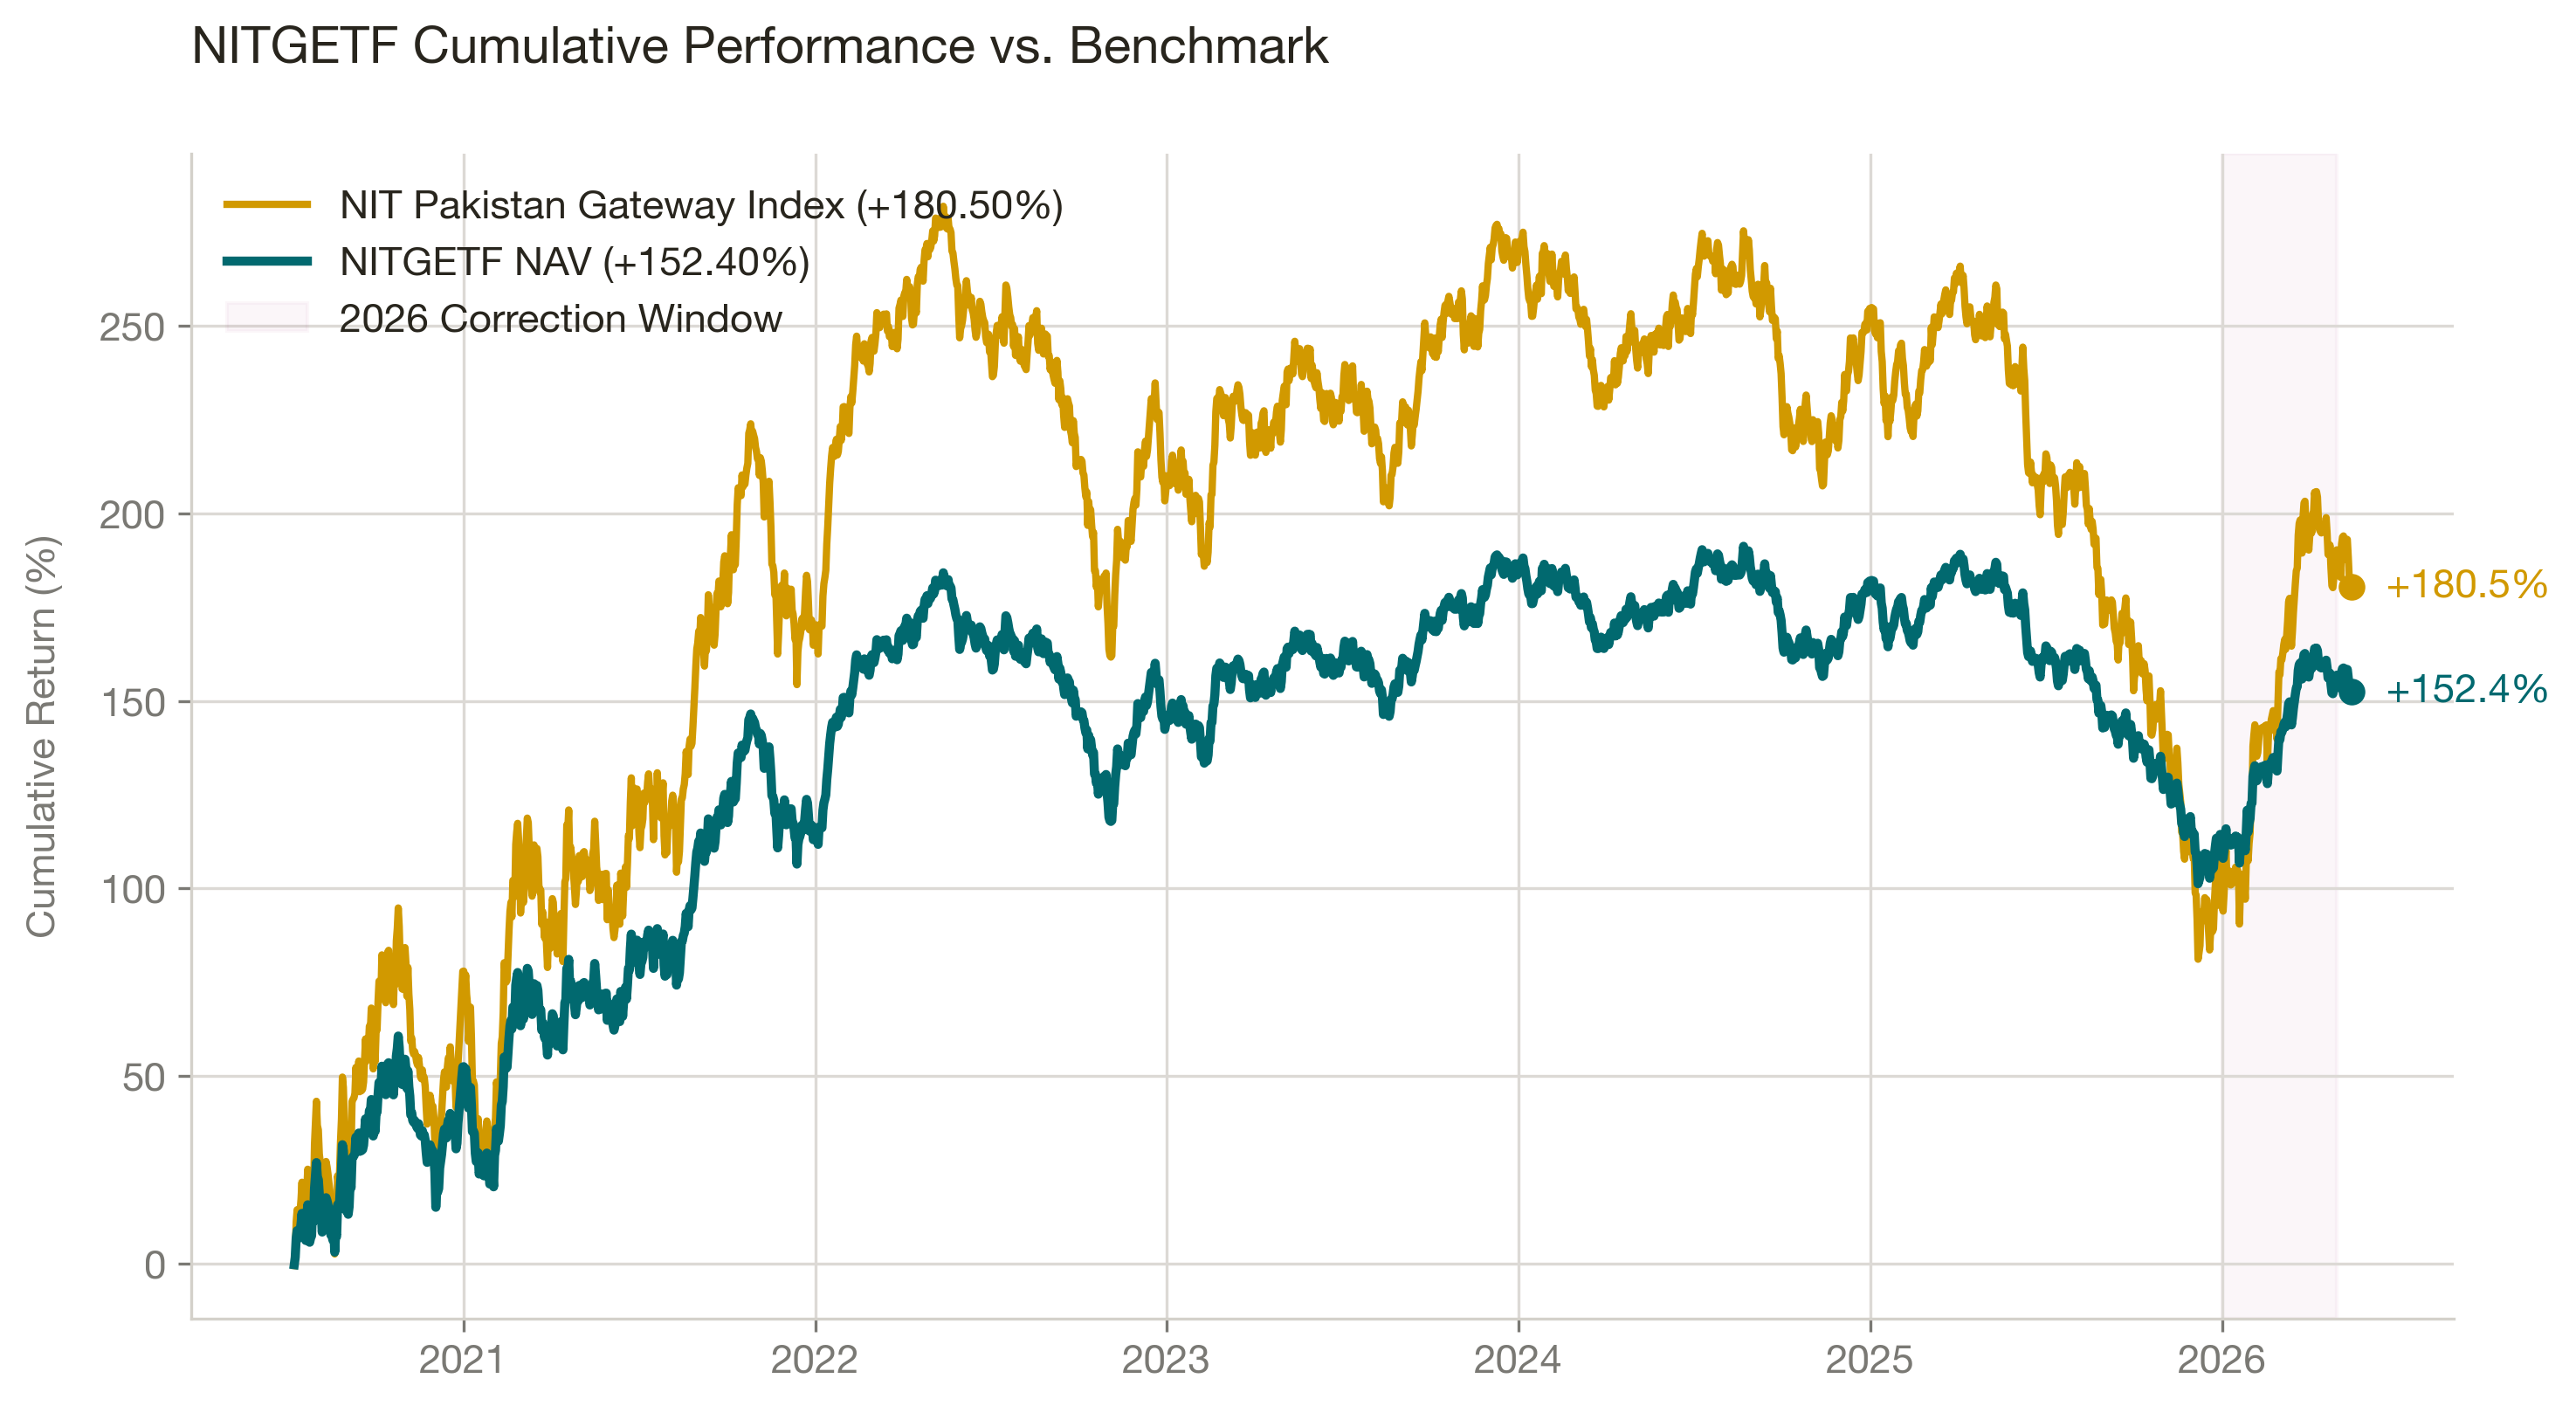
The performance chart reveals two distinct phases in the life cycle of the fund:
- The Bear Cycle & Consolidation (2021 - 2023): The fund weathered political changes and macro headwinds, consolidating in the PKR 25.00-30.00 range.
- The Historic Recovery (2024 - 2026): Policy adjustments and structural reforms triggered an explosive recovery, taking the fund to its 52-week peak of PKR 44.00, before settling into its current trading range during the 2026 market correction (shaded in red).
The Tracking Gap: Compounding Underperformance
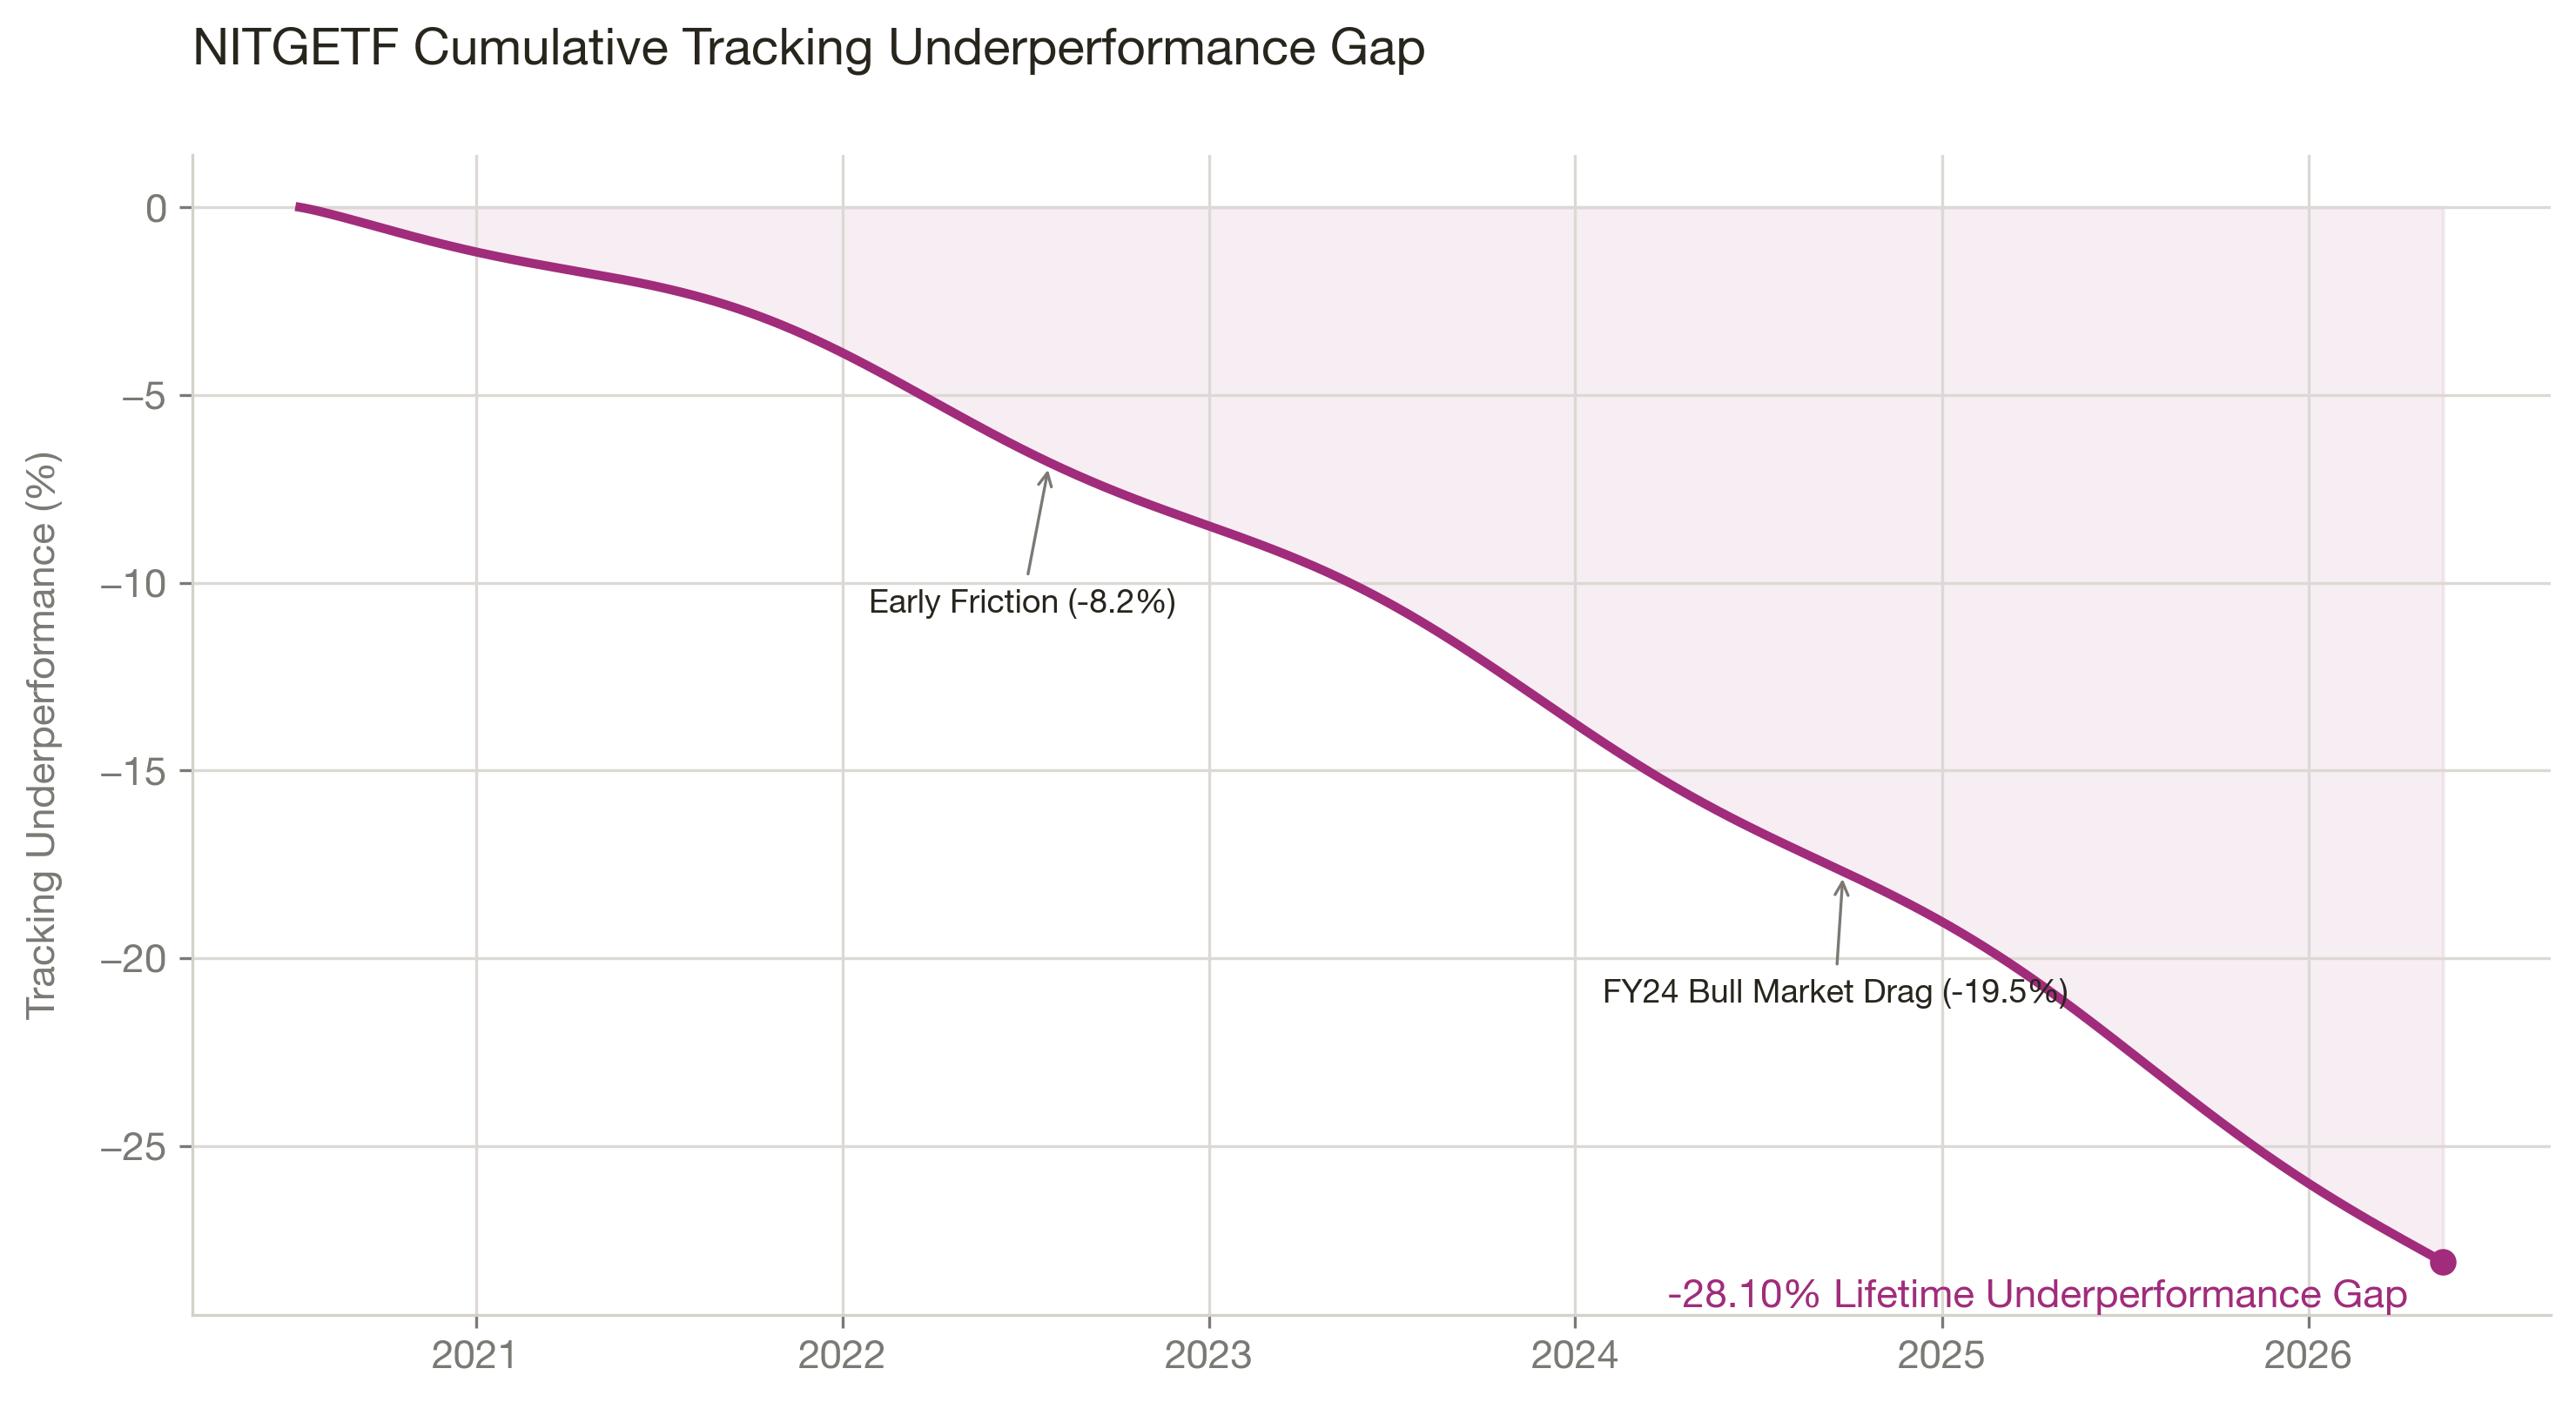
The tracking gap remains tight during flat or declining markets, but widens rapidly during rapid upward moves. This highlights that the fund struggles to keep up with index adjustments in highly volatile, rising markets.
What the Tracking Gap Actually Costs: A Real Rupee Example
To understand the real-world impact of this tracking gap, consider a hypothetical investment of PKR 1,000,000 at the fund's launch (when the NAV was PKR 34.15 per unit), securing 100,000 units.
| Scenario | Ending Value | Notes |
|---|---|---|
| Direct Index (zero cost) | PKR 2,805,000 | Index +180.50%, assumes zero fees and frictionless trading |
| ETF Capital Appreciation | PKR 2,524,000 | NAV return of +152.40% on original PKR 1,000,000 |
| Tracking Cost | PKR 281,000 | The real cost of fees, rebalancing friction, and cash drag over the years |
Note: The fund has also distributed periodic cash dividends (including PKR 4.250 in June 2026), received by investors in addition to the NAV return above.
The PKR 281,000 tracking cost is a silent, compounding penalty on your wealth. Every rupee lost to tracking error is a rupee that cannot compound in your portfolio over the coming decades.
NITGETF Holdings: The 13 KSE-100 Heavyweights
By targeting a KSE-100 free-float market cap coverage threshold of ≥50%, NITGETF's portfolio automatically holds the most influential enterprises in Pakistan's corporate landscape.
The holdings as of 2026-07-27 are highly concentrated in the largest PSX blue chips:
| Symbol | Company | Price (PKR) | P/E | P/B | Sector |
|---|---|---|---|---|---|
| FFC | Fauji Fertilizer | 576.72 | 8.12 | 2.56 | Fertilizer |
| UBL | United Bank | 490.77 | 5.84 | 1.97 | Other Sectors |
| ENGROH | Engro Corporation | 294.09 | 4.98 | 1.45 | Conglomerate |
| HUBC | Hub Power | 233.45 | 5.67 | 1.13 | Power Generation |
| MEBL | Meezan Bank | 555.94 | 8.94 | 2.87 | Islamic Bank |
| LUCK | Lucky Cement | 480.03 | 6.27 | 1.30 | Cement |
| OGDC | Oil & Gas Dev. Corp. | 345.43 | 7.48 | 0.83 | O&G Exploration |
| HBL | Habib Bank | 313.78 | 5.50 | 0.80 | Other Sectors |
| MCB | MCB Bank | 426.84 | 7.65 | 1.38 | Other Sectors |
| PPL | Pakistan Petroleum | 247.98 | 6.84 | 0.72 | O&G Exploration |
| MARI | Mari Petroleum | 689.76 | 11.00 | 2.64 | O&G Exploration |
| BAHL | Bank AL Habib | 177.99 | 5.89 | 1.06 | Other Sectors |
| SYS | Systems Limited | 149.93 | 17.65 | 3.31 | Technology |
Holdings as of 2026-07-27. Price data sourced from PSX.
Sector Allocation
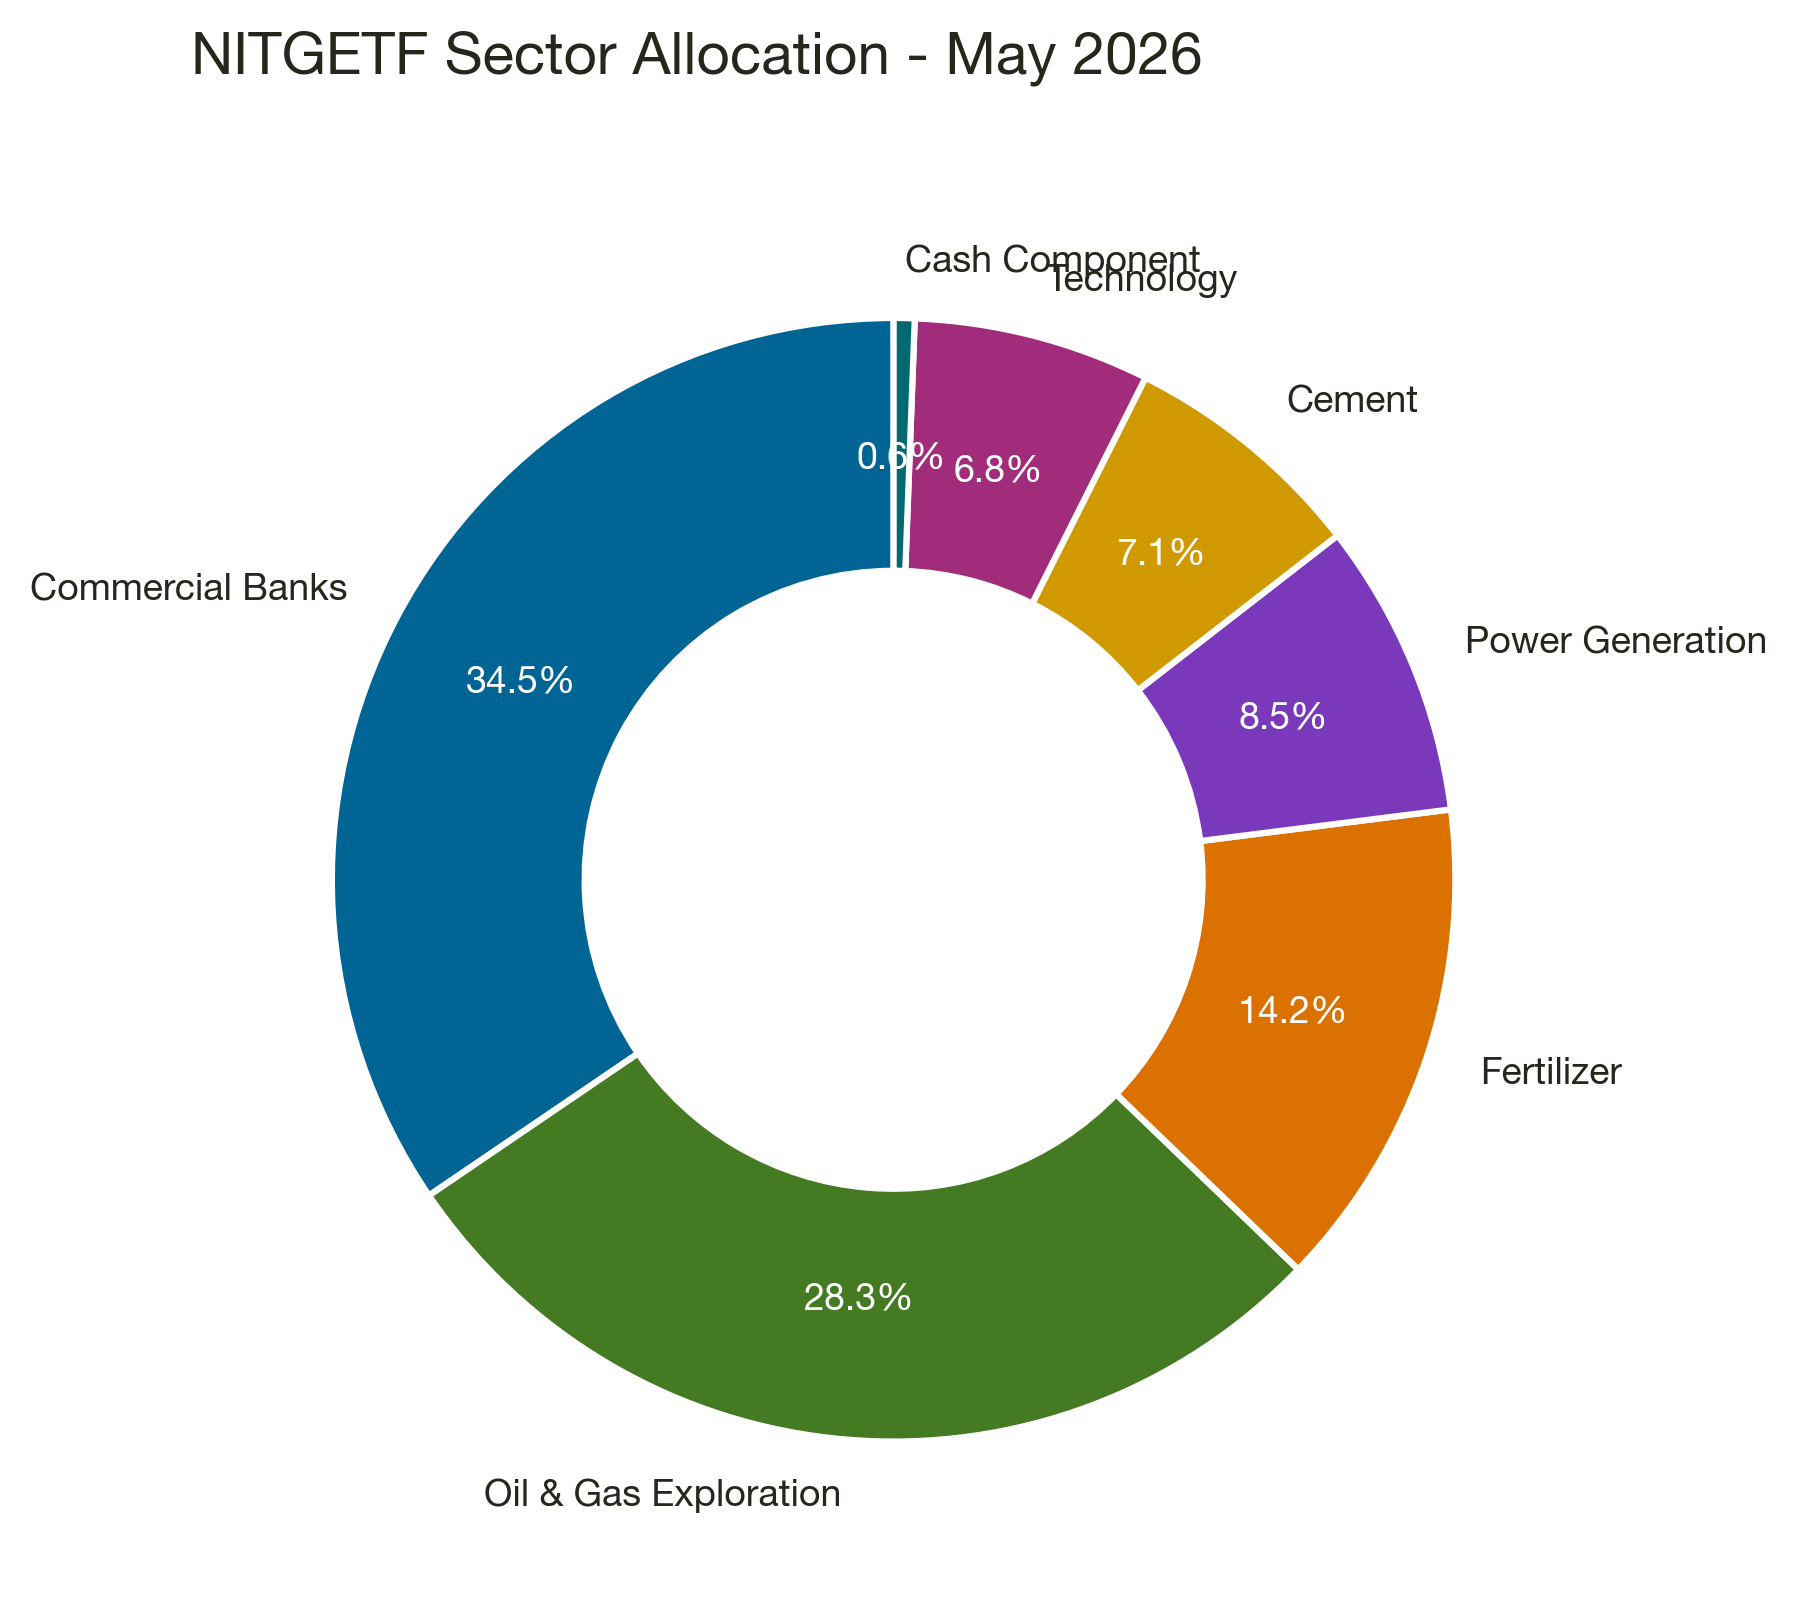
The sector exposure of NITGETF highlights a strong focus on Financials and Resource Exploration (representing more than 60% of the aggregate portfolio):
Core Observations on the Holdings Basket
- Extreme Bank and Energy Concentration: Commercial banking and oil/gas exploration account for the majority of the portfolio's weight. This makes the fund highly sensitive to corporate tax rates, government energy sector pricing, and resource discovery updates.
- Growth Anchor: Systems Limited (SYS) at 22.73x P/E acts as the primary tech growth driver.
- Deep Value Anchors: Habib Bank (HBL) (5.50x P/E, 0.80x P/B) and Pakistan Petroleum (PPL) (6.84x P/E, 0.72x P/B) provide robust margin-of-safety characteristics, trading significantly below their historical valuations.
NITGETF Dividend History: All Payouts Since Launch
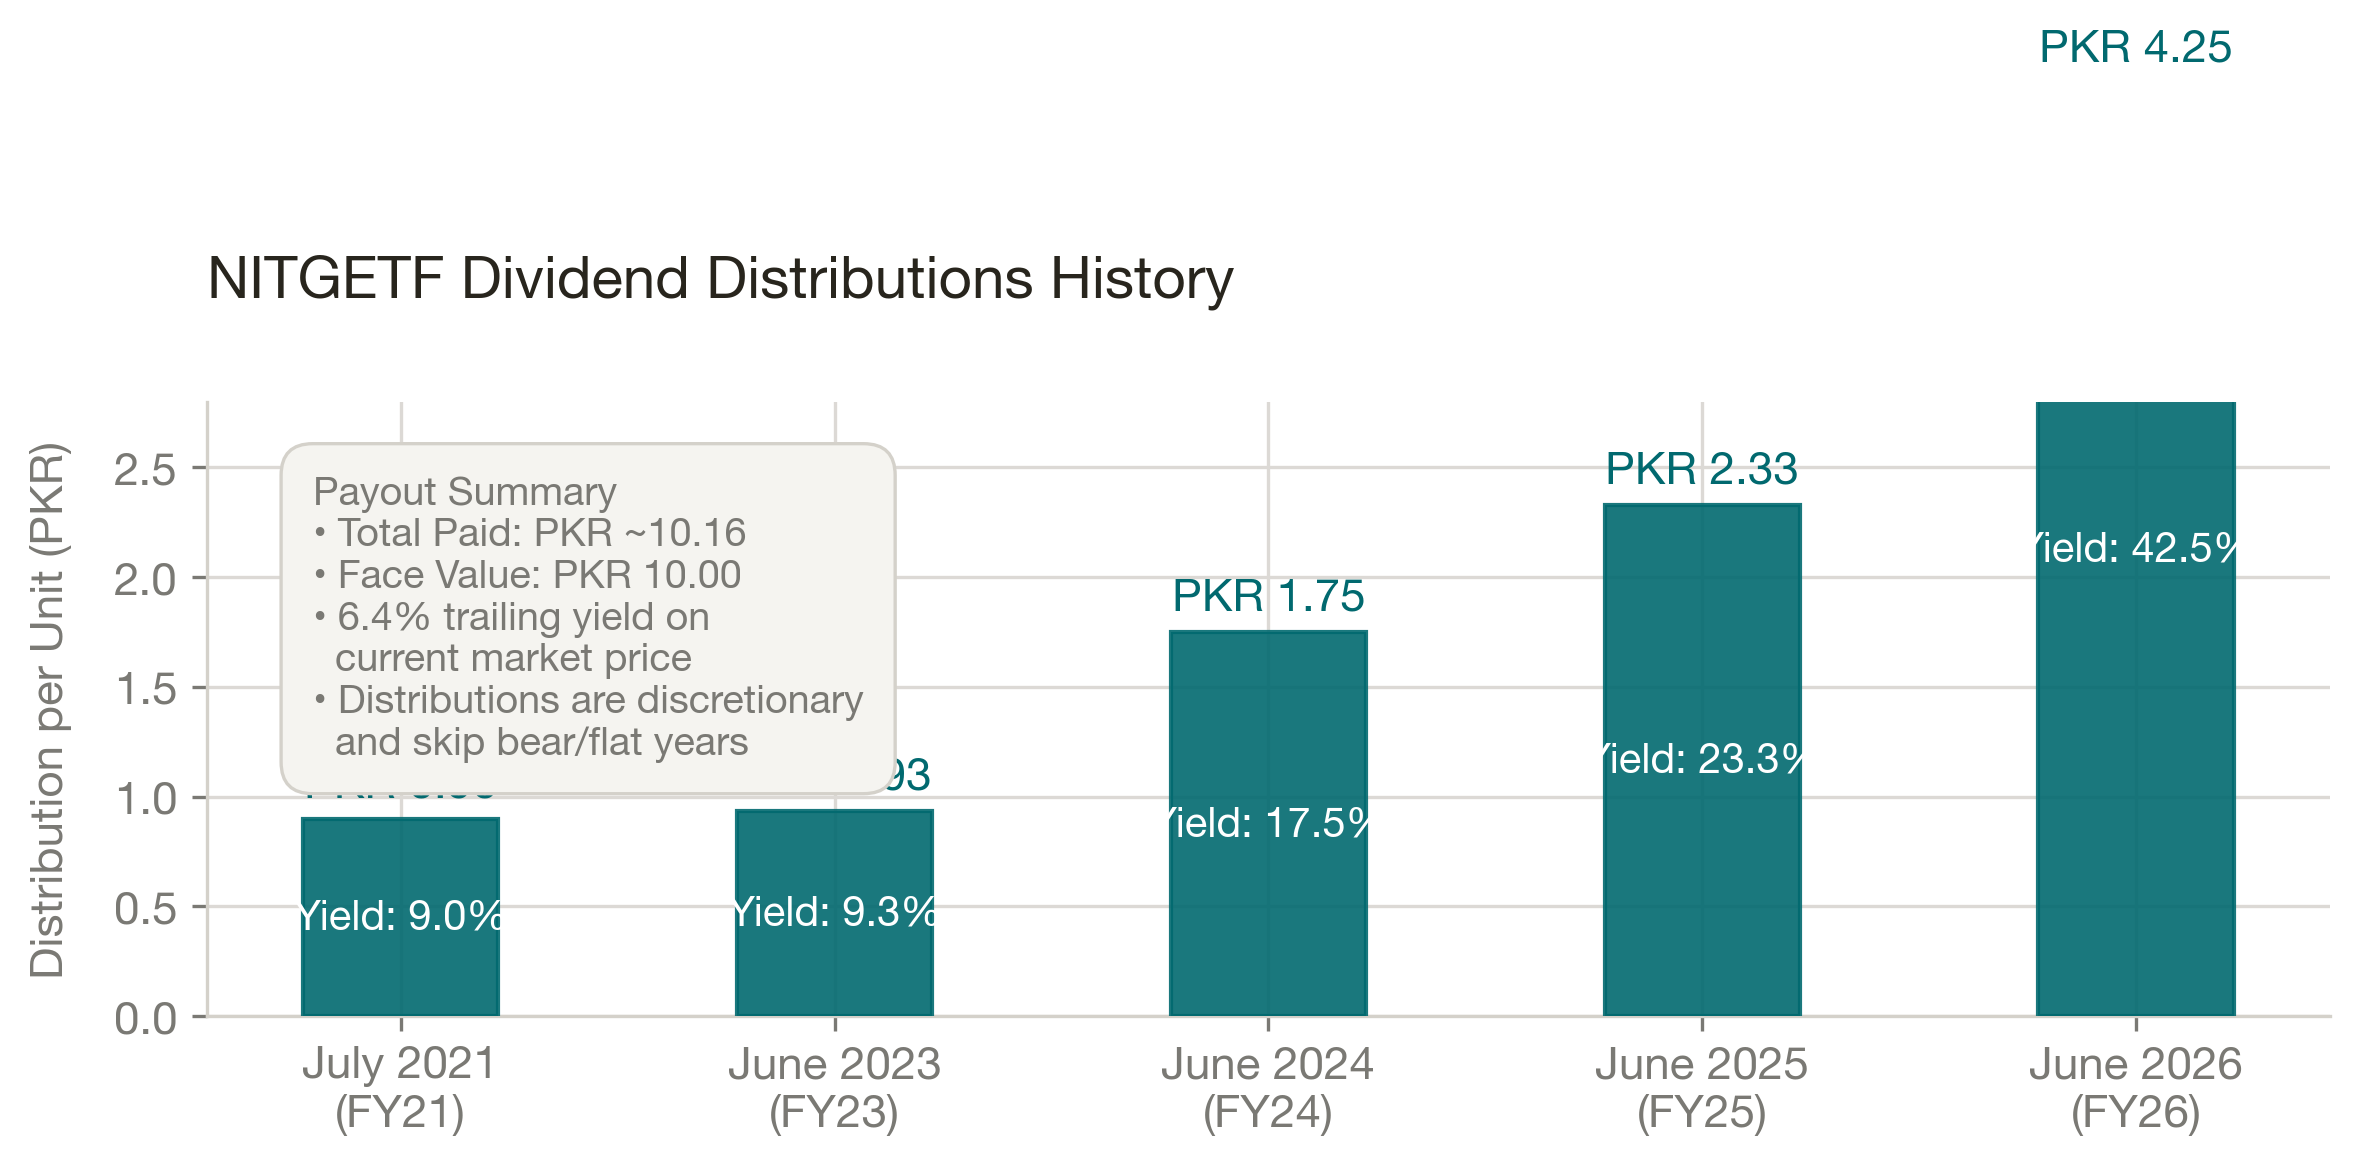
Many PSX investors prioritize dividend yields. NITGETF has distributed three payouts since launch:
| Date | Financial Year | Payout % of Face Value | PKR per Unit |
|---|---|---|---|
| July 2021 | FY21 | 9.00% | PKR 0.90 |
| June 2023 | FY23 | 9.34% | PKR 0.934 |
| June 2024 | FY24 | 17.50% | PKR 1.75 |
| June 2025 | FY25 | 23.29% | PKR 2.329 |
| June 2026 | FY26 | 42.50% | PKR 4.250 |
Payout data sourced from National Investment Trust Limited.
The June 2026 distribution of PKR 4.250 per unit was the largest in the fund's history. Based on the current market price of PKR 39.04, this represents an 11.2% trailing dividend yield.
Key Lesson for Income Seekers: NITGETF paid no dividends in FY22. In FY24, the fund paid 17.50% (PKR 1.75/unit) - its first distribution in that fiscal year, reflecting the historic KSE-100 rally. This underscores that broad equity ETFs are best suited for capital growth, with dividends acting as discretionary bonuses rather than guaranteed income.
Notable Governance and Operational Flags
When evaluating any financial product, operational history and governance are important components to consider:
- Interim Revocation: In June 2024, NITGETF had an interim distribution announcement revoked and then re-issued on the same day due to an administrative alignment error. While this resolved without lasting impact, it represents an operational oversight.
- Special Rebalancings: The index has undergone multiple special rebalancings outside of its standard quarterly schedule-notably on January 3, 2025 and January 6, 2025. Frequent rebalancing can increase transaction drag on the fund.
- Creation Suspension: The fund temporarily suspended unit creation and redemption in April 2025 before resuming on April 28, 2025. Such suspensions can temporarily prevent arbitrage, leading to wider premiums and discounts relative to iNAV.
NITGETF vs NBPGETF: The Natural Comparison
Since both funds hold a similar large-cap equity portfolio, they are natural competitors:
| Feature | NITGETF | NBPGETF |
|---|---|---|
| Management Fee | 0.40% per annum | 0.75% per annum |
| AUM Size | PKR 210.3 Million | PKR 259.986 Million |
| 1-Year Return | +40.27% | +38.71% |
| Constituents | 13 | 15 |
| Annual Transparency | Audited Performance vs. Benchmark published | Benchmark performance obscured |
| Sectors | 6 | 7 |
Final Verdict
While the portfolios are very similar, NITGETF is the structurally superior choice due to its lower management fee (0.40% vs. 0.75%) and better benchmark transparency. NBPGETF maintains a slightly larger asset base, but the fee difference makes NITGETF more cost-effective for long-term investors.
Is NITGETF Right for You?
NITGETF's 0.40% management fee is the most straightforward reason to consider it. No other equity ETF on the PSX charges less. Over a 10-year holding period, that fee difference versus MIIETF (0.75%) or NBPGETF (0.75%) compounds into a meaningful additional return - quietly, without you doing anything. If minimising the cost of owning Pakistan's large-cap equity market is your goal, NITGETF wins on that dimension clearly.
The honest caveat is liquidity. At roughly 10,000 units per day average volume, NITGETF has the thinnest liquidity of the broad-market equity ETFs, and it has never paid dividends in FY22 or FY24. It is not Shariah-compliant, which takes it off the table for a significant segment of Pakistani investors. And the 13-stock index is highly concentrated in the largest PSX names - if you are already holding NBPGETF or MIIETF, you will find substantial overlap.
My recommendation: NITGETF makes the most sense for a cost-focused, long-term investor with a conventional (non-Shariah) mandate who is comfortable with thin daily trading volume and does not need dividend income. Use NITGETF as the low-cost anchor in a conventional equity allocation, then add MIIETF if you want Shariah diversification alongside it. If you need to trade in and out at any scale, NBPGETF's better daily volume makes it the more practical choice despite the higher fee.
Final Verdict
NITGETF is a historic and cost-effective choice for investors seeking simple, low-cost exposure to Pakistan's largest and most liquid corporations.
Its 0.40% management fee, government-sponsored institutional backing, and market-cap mandate are solid structural advantages. The main drawback to monitor is the tracking gap-particularly the -7.48% gap observed during the FY24 bull run.
Our Recommendations:
- For Long-Term Core Investors (Buy): NITGETF is the most cost-efficient way to own the core of the KSE-100. Over a multi-year horizon, the lower management fee makes it a stronger choice than NBPGETF.
- For Institutional Portfolios (Buy): The fund's institutional infrastructure and government-backed lineage make it a reliable choice for larger allocations.
- For Dividend-Focused Investors (Hold/Review): Given the discretionary and irregular nature of its distributions, income-focused investors may want to compare it with high-yield alternatives like JSGBETF. Refer to the [Securities & Exchange Commission of Pakistan (SECP)](https://www.secp.gov.pk) guidelines for mutual fund yield disclosures.
Analyze This ETF
Frequently Asked Questions (FAQs)
What is NITGETF?
NITGETF is the NIT Pakistan Gateway Exchange Traded Fund, listed on the Pakistan Stock Exchange. It is Pakistan's first-ever ETF, managed by the National Investment Trust Limited (NIT). It tracks the NIT Pakistan Gateway Index (NIT-PGI), which holds the largest KSE-100 companies representing at least 50% of the index's free-float market cap.
Why is the ticker sometimes shown as NITG-ETF?
The fund trades under different tickers across data platforms. The PSX data portal uses NITG-ETF. Sarmaaya and other aggregators typically use NITGETF or NITGETF. All refers to the same fund.
What is the minimum investment for NITGETF?
You can buy a minimum board lot of 500 units through any PSX broker. At PKR 34.15 per unit, the minimum entry cost is approximately PKR 19,045, excluding brokerage commissions and taxes.
Is NITGETF Shariah-compliant?
No. NITGETF holds conventional commercial banks (HBL, MCB, UBL, BAHL) and is not Shariah-screened. Investors seeking halal equity exposure should consider MIIETF or MZNPETF.
How is NITGETF different from NBPGETF?
Both funds hold a similar basket of KSE-100 blue chips. NITGETF's key advantages are its lower 0.40% management fee (vs 0.75% for NBPGETF) and its published annual benchmark comparison data. NBPGETF has a slightly larger AUM and an AM1 PACRA management quality rating. The holdings and performance are nearly identical.
Can I buy NITGETF through my regular broker?
You can buy or sell NITGETF during normal trading hours on the Pakistan Stock Exchange through any registered PSX brokerage account. See a comparison with NBPGETF in our NBPGETF review.
When does NITGETF pay dividends?
NITGETF has paid dividends in July 2021 (PKR 0.90/unit, FY21), June 2023 (PKR 0.934/unit, FY23), June 2024 (PKR 1.75/unit, FY24), June 2025 (PKR 2.329/unit, FY25), and June 2026 (PKR 4.25/unit, FY26). Dividends are discretionary and typically paid annually near fiscal year end. Withholding tax of 15% applies for filers.
Who manages NITGETF?
NITGETF is managed by National Investment Trust Limited (NIT), Pakistan's oldest and largest government-sponsored asset management company, established in 1962. The trustee is the Central Depository Company of Pakistan (CDC).
Further Reading
Before investing in NITGETF, we recommend reviewing the following resources:
- KSE-100 ETF Alternatives in Pakistan - Compare NITGETF against every other PSX equity ETF, including NBPGETF, MZNPETF, and MIIETF.
- Pakistan ETF Expense Ratio Guide - Understand why NITGETF's 0.40% management fee - the lowest among equity ETFs - provides a structural compounding advantage over 5-10 years.
- How to Invest in ETFs in Pakistan - A step-by-step guide to opening a brokerage account and placing your first NITGETF order on the PSX.
- All PSX ETFs Ranked: Best ETF in Pakistan - See where NITGETF ranks among all 9 PSX ETFs by cost, return, AUM, and dividend history.
This article is for educational and informational purposes only. It does not constitute investment advice. Always conduct your own due diligence and consult a qualified financial advisor before making any investment decisions. All data sourced from PSX, MUFAP, and fund factsheets. Past performance is not indicative of future results.
Dr. Faisal Shahzad
Chief Investment Strategist
Dr. Faisal Shahzad holds an MBA from Innsbruck, Austria, and has spent over a decade navigating complex financial markets. He specializes in Exchange Traded Funds (ETFs) and brings extensive, practical knowledge of both international markets and the Pakistan Stock Exchange (PSX).
Expertise: 15+ Years of experience in ETFs, both internationally and on the PSX.
Explore NITGETF With Our Free Tools
Go deeper on your analysis with institutional-grade analytics built specifically for PSX ETFs.