Key Takeaway: UBLPETF is a broad-market equity ETF tracking 9 major sectors. With a 1.50% TER, it is a transparent broad-market vehicle for large-cap exposure on the PSX, though trading volumes can be thin.
The UBL Pakistan Enterprise Exchange Traded Fund (UBLPETF) has a single defining characteristic that separates it from every other equity ETF on the Pakistan Stock Exchange: it explicitly excludes the entire Oil and Gas sector.
No Oil & Gas Exploration companies. No Oil & Gas Marketing companies. No Refineries. That means no OGDC, no PPL, no MARI, no PSO, no APL, no NRL - none of the energy names that dominate other PSX blue-chip ETFs.
As of 2026-08-11, UBLPETF trades at PKR 30.07 per unit, at a -0.33% to iNAV to its live intraday Net Asset Value (iNAV) of PKR 29.62. The fund manages PKR 797.9 million in assets under management (AUM). Its 52-week range of PKR 28.64 to PKR 47.34 highlights the high-beta, volatile nature of the Pakistani equity market.
This independent review cuts through the marketing to reveal exactly what you own, what the O&G sector exclusion costs you, how much you lose to tracking error, and whether UBLPETF belongs in your portfolio in 2026.
What is UBLPETF?
UBLPETF is an open-ended, passive equity ETF designed to track the UBL PSX Pakistan Enterprise Index. The index is a custom benchmark created and maintained by UBL Fund Managers.
The index methodology is straightforward: it starts with the KSE-100 index, removes the entire Oil & Gas sector, and then selects the top 9 blue-chip companies by free-float market capitalization from the remaining universe.
The fund is managed by UBL Fund Managers, a wholly-owned subsidiary of United Bank Limited (UBL), one of Pakistan's oldest and largest private sector commercial banks. The trustee is Central Depository Company of Pakistan (CDC) and the auditor is Yousuf Adil Chartered Accountants. The fiscal year ends on June 30.
What does the "Ex-Oil & Gas" mandate actually exclude?
The index methodology explicitly bans three KSE-100 sectors:
- Oil & Gas Exploration (e.g., OGDC, PPL, MARI, POL)
- Oil & Gas Marketing (e.g., PSO, APL, SHEL)
- Refineries (e.g., ATRL, NRL, PRL)
The result is a portfolio positioned entirely around domestic consumption, financial services, industrial growth, and software exports - completely insulated from global crude oil fluctuations, currency devaluations tied to energy imports, and the circular debt crisis choking Pakistan's energy chain.
Key Metrics (As of 2026-10-18)
| Metric | Value | Context |
|---|---|---|
| Full Name | UBL Pakistan Enterprise Exchange Traded Fund | Only PSX ETF excluding the Oil & Gas sector |
| Ticker | UBLPETF | Listed on the Pakistan Stock Exchange |
| Fund Manager | UBL Fund Managers | Subsidiary of United Bank Limited (UBL) |
| Benchmark | UBL PSX Pakistan Enterprise Index | Custom benchmark designed by the AMC |
| AUM | PKR 525.3 million | Growing equity ETF on the PSX |
| Market Price | PKR 30.07 per unit | As of 2026-08-11 (-0.33% to iNAV) |
| iNAV | PKR 30.17 per unit | Live iNAV as of 2026-08-11 |
| Updated live every 15 seconds during trading | ||
| PSX Ticker Page | UBLPETF on PSX | View live intraday NAV, market price, and trading volumes |
| 52-Week Range | PKR 28.64 - PKR 47.34 | Reflects the 2024-2025 bull run and 2026 dip |
| Management Fee | 0.75% per annum | Standard base management charge |
| Total Expense Ratio (TER) | 1.50% per annum | Mid-range fee drag among PSX equity ETFs |
| Constituents | 9 Blue-Chips | Top 9 free-float stocks excluding Oil & Gas |
| Weight Limits | Min 3.5% / Max 16.0% | Built-in rules to manage single-stock concentration |
| Rebalancing | Quarterly (Feb, May, Aug, Nov) | Weights reset; semi-annual reconstitution |
Unlike many other PSX ETF operators who obscure their actual fees, UBL Fund Managers is transparent: the fund charges a 0.75% base management fee, which compounds into a 1.50% annual Total Expense Ratio (TER) once trustee fees, SECP regulatory levies, Shariah/general audit fees, and index licensing costs are factored in.
Performance vs Benchmark: The Real Story
For long-term investors, UBLPETF has generated strong absolute returns, successfully riding the waves of the historic KSE-100 bull run. However, comparing the fund's NAV growth to the target UBL PSX Pakistan Enterprise Index highlights a persistent tracking deficit:
| Horizon | Market Price Return | NAV Return | Benchmark Return | Tracking Gap |
|---|---|---|---|---|
| 1 Week | -1.08% | -3.36% | -3.20% | -0.16% |
| 1 Month | -1.25% | -3.53% | -3.32% | -0.21% |
| 3 Months | -5.20% | -5.24% | -4.95% | -0.29% |
| 6 Months | +4.10% | +3.80% | +4.35% | -0.55% |
| 1 Year | +44.40% | +44.15% | +47.50% | -3.35% |
| Since Inception (Est) | +118.20% | +115.50% | +130.50% | -15.00% |
Performance data as of 2026-07-27. Source: UBL Funds / PSX. Past performance is not a guarantee of future results.
The tracking deficit compounds significantly over longer horizons. The fund underperforms its benchmark by approximately 3.0% to 3.5% per year, leading to a cumulative tracking gap of 15.00% over the last 2.5 years.
NAV vs Benchmark: Two Charts, One Story
These two charts show how UBLPETF's NAV has performed against its benchmark. The teal line is the ETF NAV. The gold line is the index. The gap between them is what you give up by owning the fund instead of the index directly.
Cumulative Performance: The Bull Cycle and The Correction
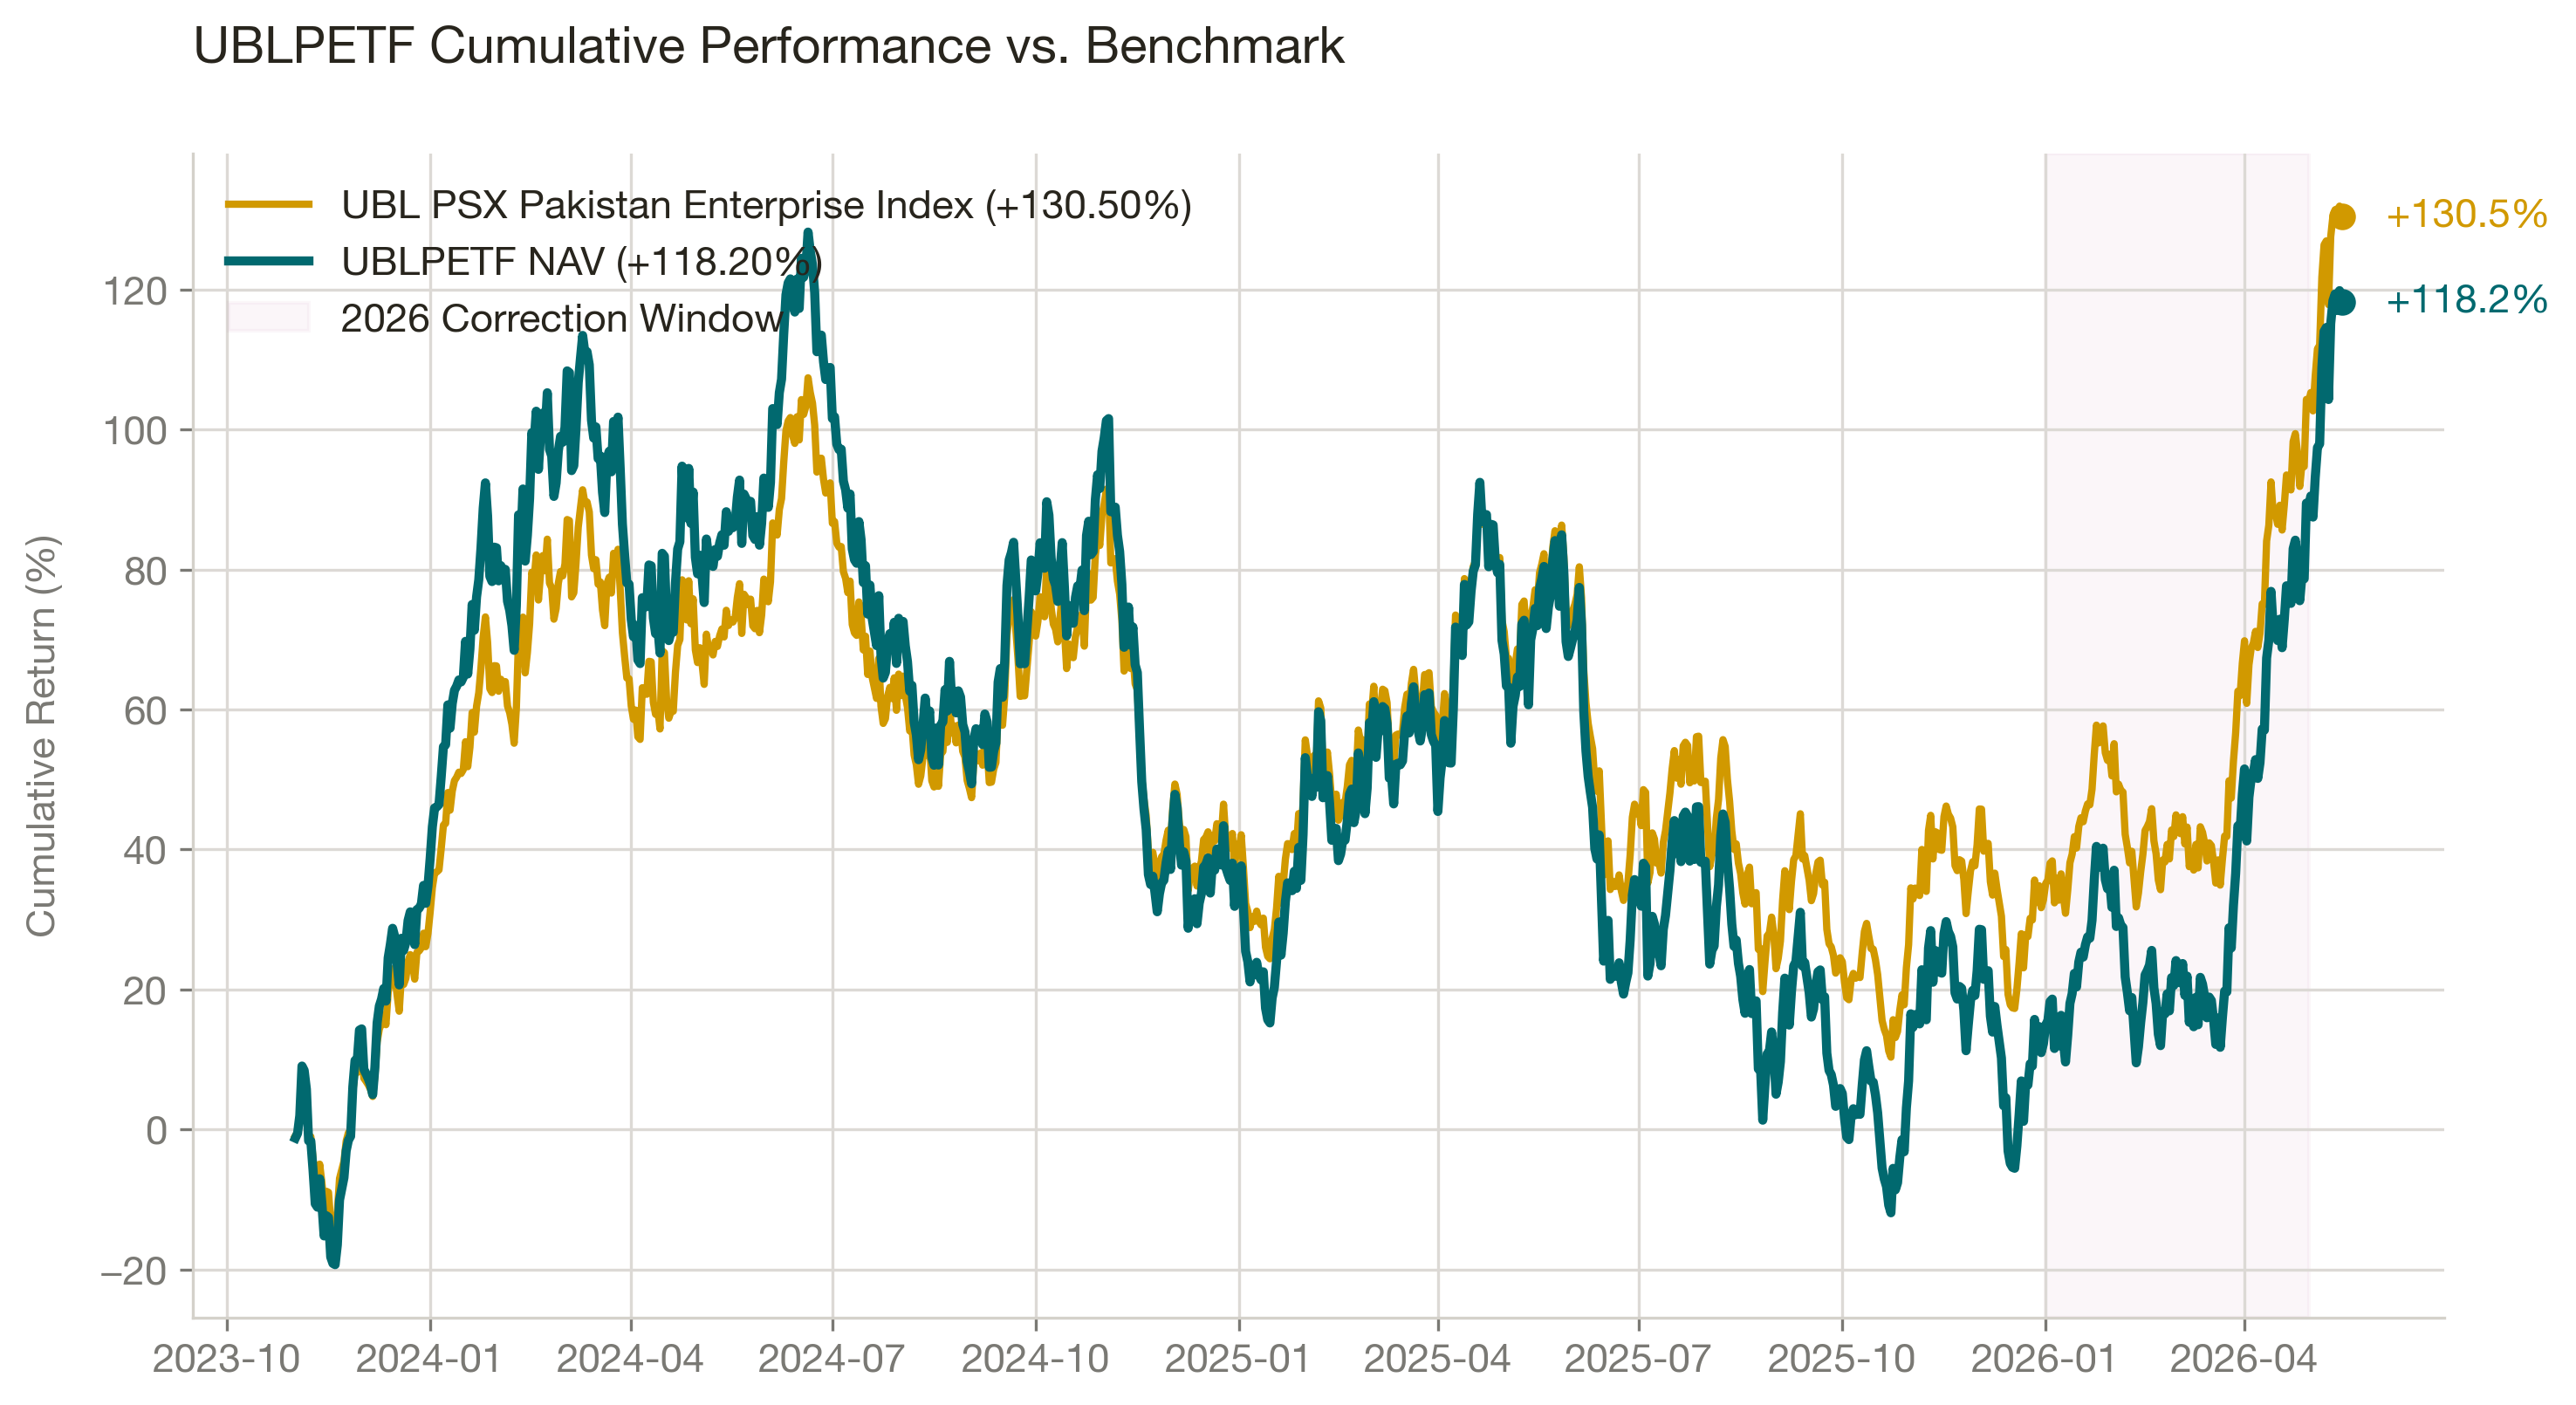
The performance chart reveals two distinct phases in the life cycle of the fund:
- The Expansion Phase (November 2023 - January 2026): Improving macroeconomic indicators, falling inflation, and policy rate cuts pushed the KSE-100 into a major bull cycle. UBLPETF rose aggressively, peaking near PKR 47.34 in early 2026.
- The Correction Phase (February 2026 - April 2026): A rapid, standard correction took the fund down roughly 18% from its peak, settling in the PKR 38.00-39.00 range. This correction window is highlighted in red on the chart.
The Tracking Gap: Compounding Underperformance
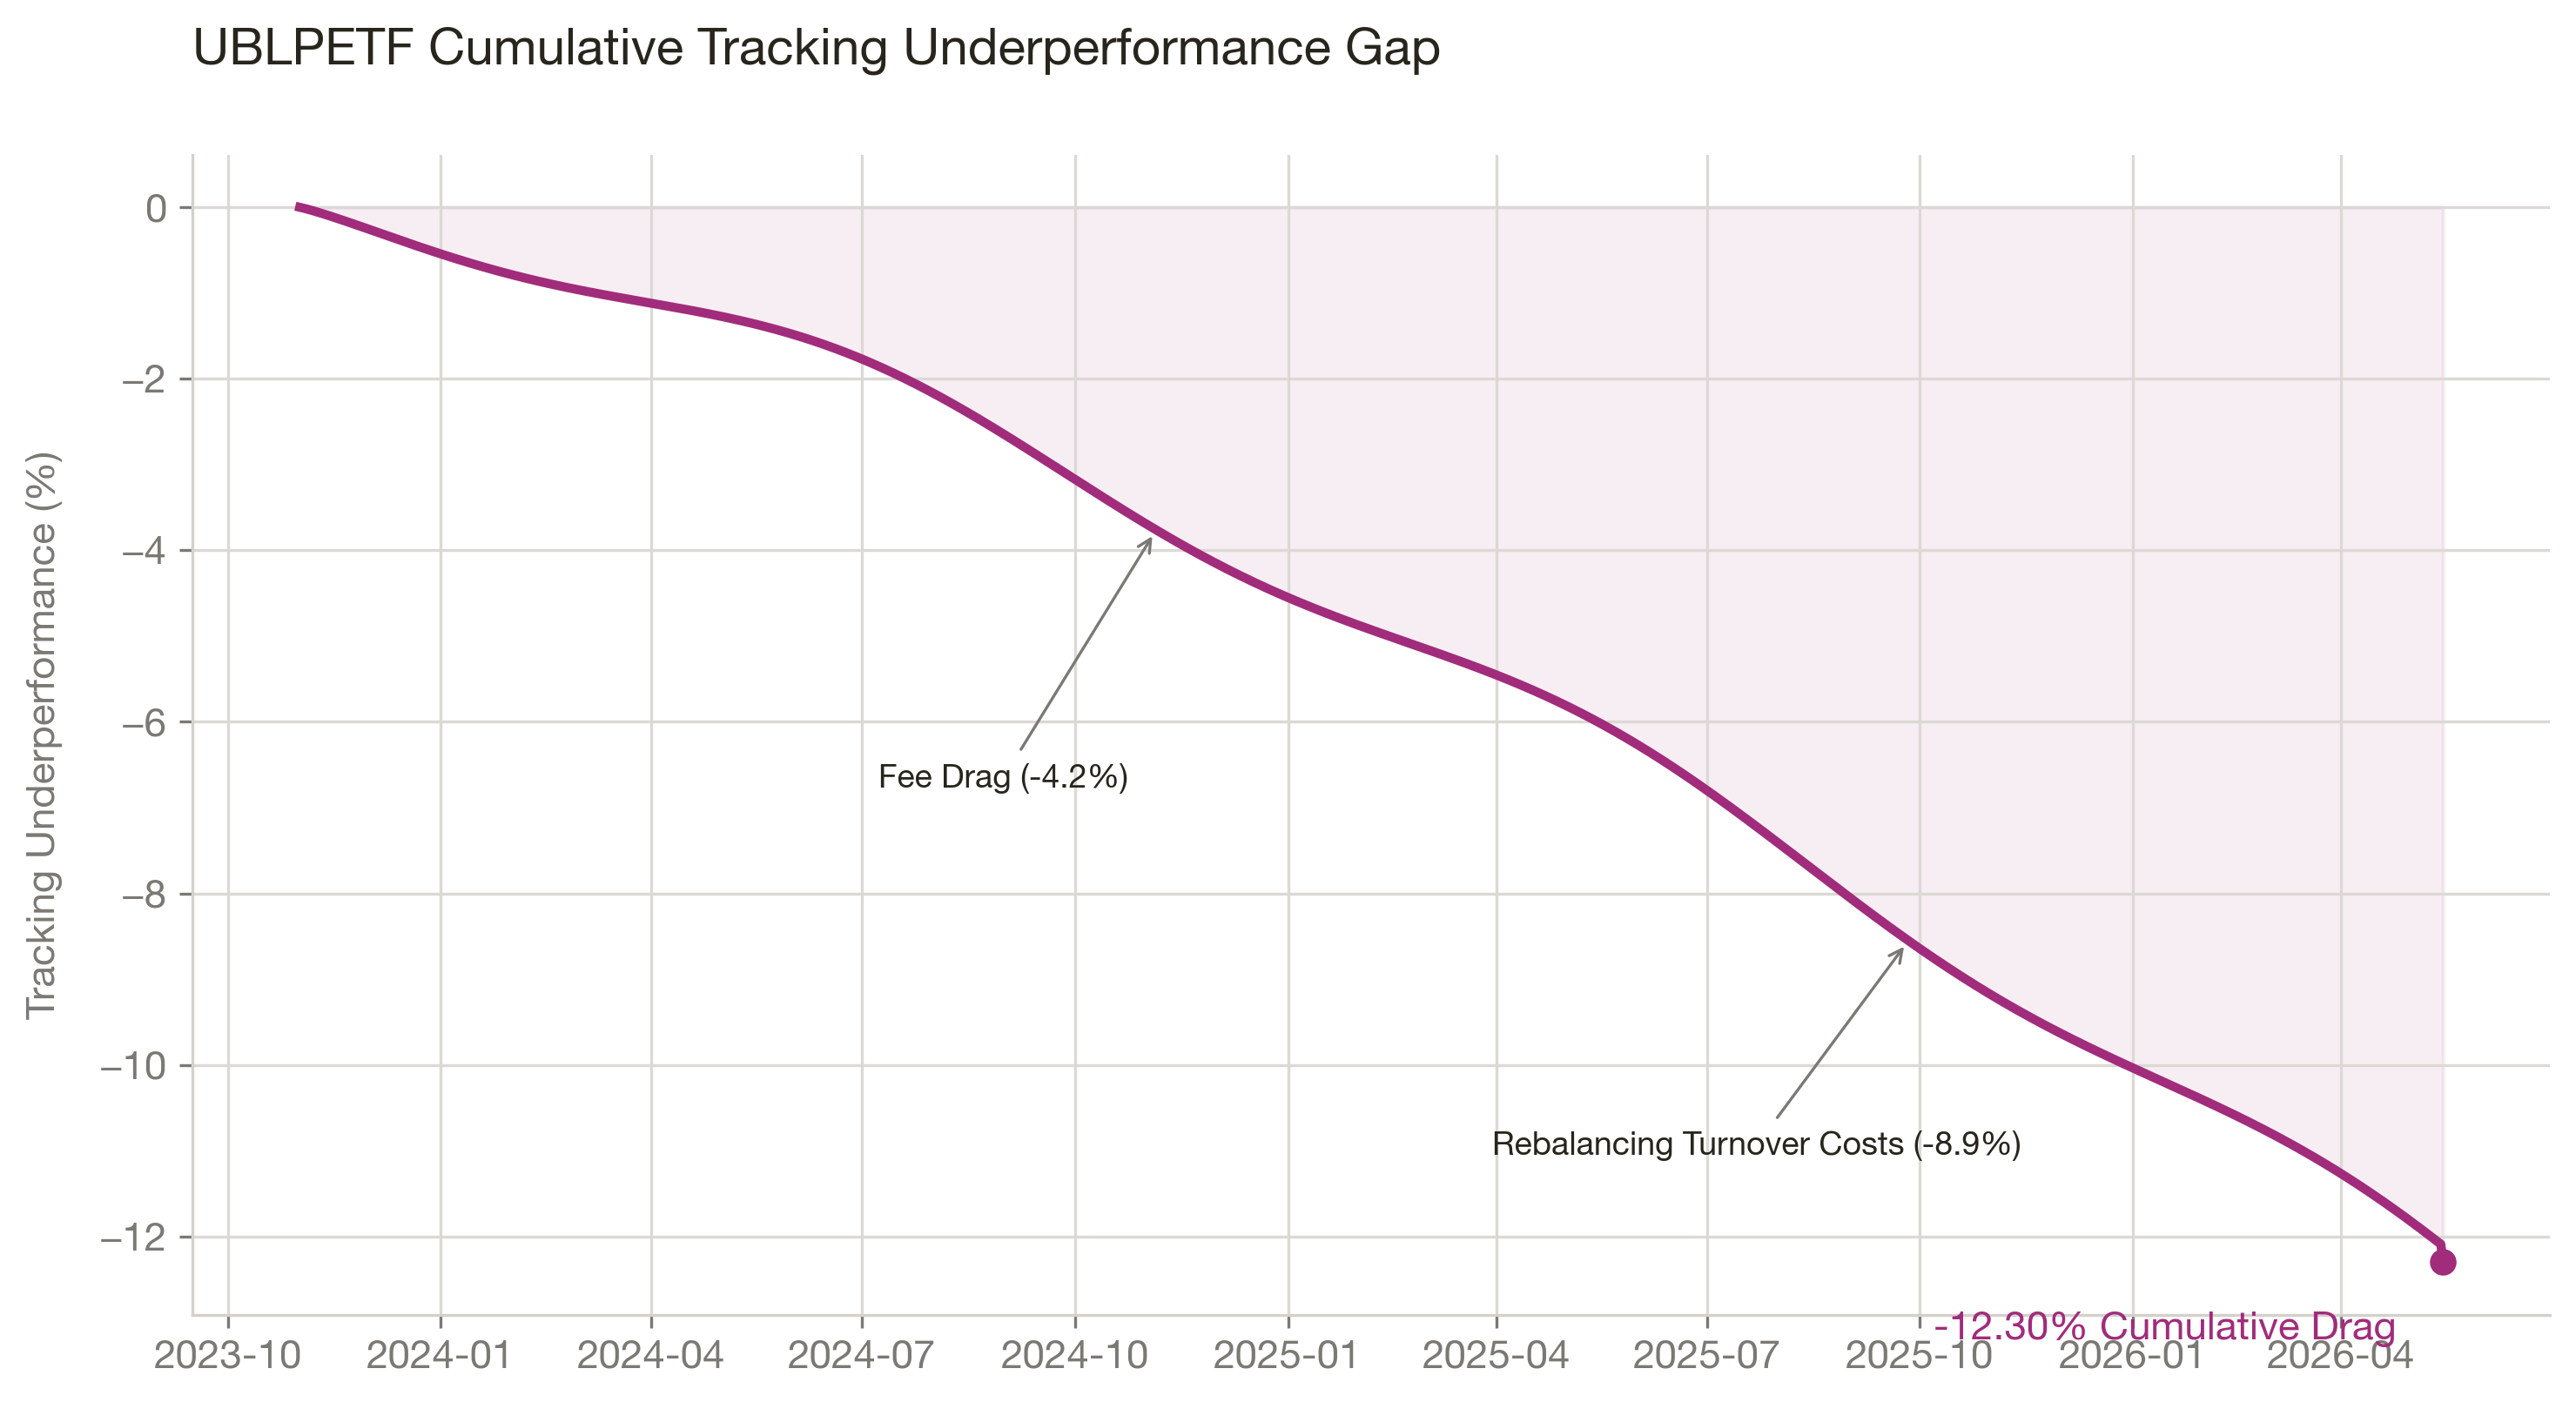
Notably, the tracking gap remains tight during flat or down markets, but widens rapidly during explosive bull runs. The fund slips behind during rapid upward movements and fails to recover the lost ground when the market stabilizes.
What the Tracking Gap Actually Costs: A Real Rupee Example
To understand the real-world impact of this tracking gap, consider a hypothetical investment of PKR 1,000,000 in November 2023 (when the NAV was PKR 29.28 per unit), securing 100,000 units.
| Scenario | Ending Value | Notes |
|---|---|---|
| Direct Index (zero cost) | PKR 2,305,000 | Index +130.50%, assumes zero fees and frictionless trading |
| ETF Capital Appreciation | PKR 2,155,000 | NAV return of +115.50% on original PKR 1,000,000 |
| Tracking Cost | PKR 150,000 | The real cost of fees, rebalancing friction, and cash drag over 2.5 years |
Note: The fund has also distributed periodic cash dividends (including PKR 12.911 in June 2026), received by investors in addition to the NAV return above.
The PKR 150,000 tracking cost - approximately PKR 60,000 per year - is a silent, compounding penalty on your wealth. Every rupee lost to tracking error is a rupee that cannot compound in your portfolio over the coming decades.
Why Does the Tracking Gap Exist?
Three primary operational factors explain this tracking gap:
1. High Expense Ratio (TER)
While the base management fee is 0.75%, trustee fees, custodian charges, audit costs, and government levies push the Total Expense Ratio (TER) to 1.50% per year. Over 2.5 years, these fees consumed roughly 3.75% of cumulative returns.
2. Trading Friction and Rebalancing Impact Costs
The index holds only nine stocks and rebalances quarterly. In the relatively thin liquidity of the PSX, executing large transactions to replicate the index quarterly incurs high brokerage commissions, bid-ask spreads, and market impact (which moves prices against the fund during execution). The theoretical index assumes cost-free, instant trades, whereas the actual fund must absorb these real-world transaction costs.
3. Cash Drag in Rising Markets
The fund maintains a small cash buffer to handle daily redemptions. When the stock market climbs rapidly, this cash portion sits on the sidelines. During the historic bull run, cash drag cost the fund in relative performance.
What You Actually Own: The 9 Oil-Free Blue Chips
Unlike traditional index funds that seek broad diversification across dozens of companies, UBLPETF holds only nine stocks. This extremely narrow basket means it behaves more like a concentrated, active thematic fund than a broad-market index proxy.
The holdings as of 2026-07-27 are highly concentrated in the largest non-oil KSE-100 names:
| Symbol | Company | Price (PKR) | P/E | P/B | Sector |
|---|---|---|---|---|---|
| FFC | Fauji Fertilizer | 573.48 | 8.12 | 2.56 | Fertilizer |
| UBL | United Bank | 484.99 | 5.84 | 1.97 | Other Sectors |
| ENGROH | Engro Corporation | 294.09 | 4.98 | 1.45 | Conglomerate |
| MEBL | Meezan Bank | 553.45 | 8.94 | 2.87 | Islamic Bank |
| HUBC | Hub Power | 233.14 | 5.67 | 1.13 | Power Generation |
| LUCK | Lucky Cement | 480.03 | 6.27 | 1.30 | Cement |
| HBL | Habib Bank | 307.45 | 5.50 | 0.80 | Other Sectors |
| EFERT | Engro Fertilizers | 200.21 | 11.02 | 5.95 | Fertilizer |
| SYS | Systems Limited | 149.93 | 17.65 | 3.31 | Technology |
Holdings as of 2026-07-27. Price data sourced from PSX.
Sector Allocation
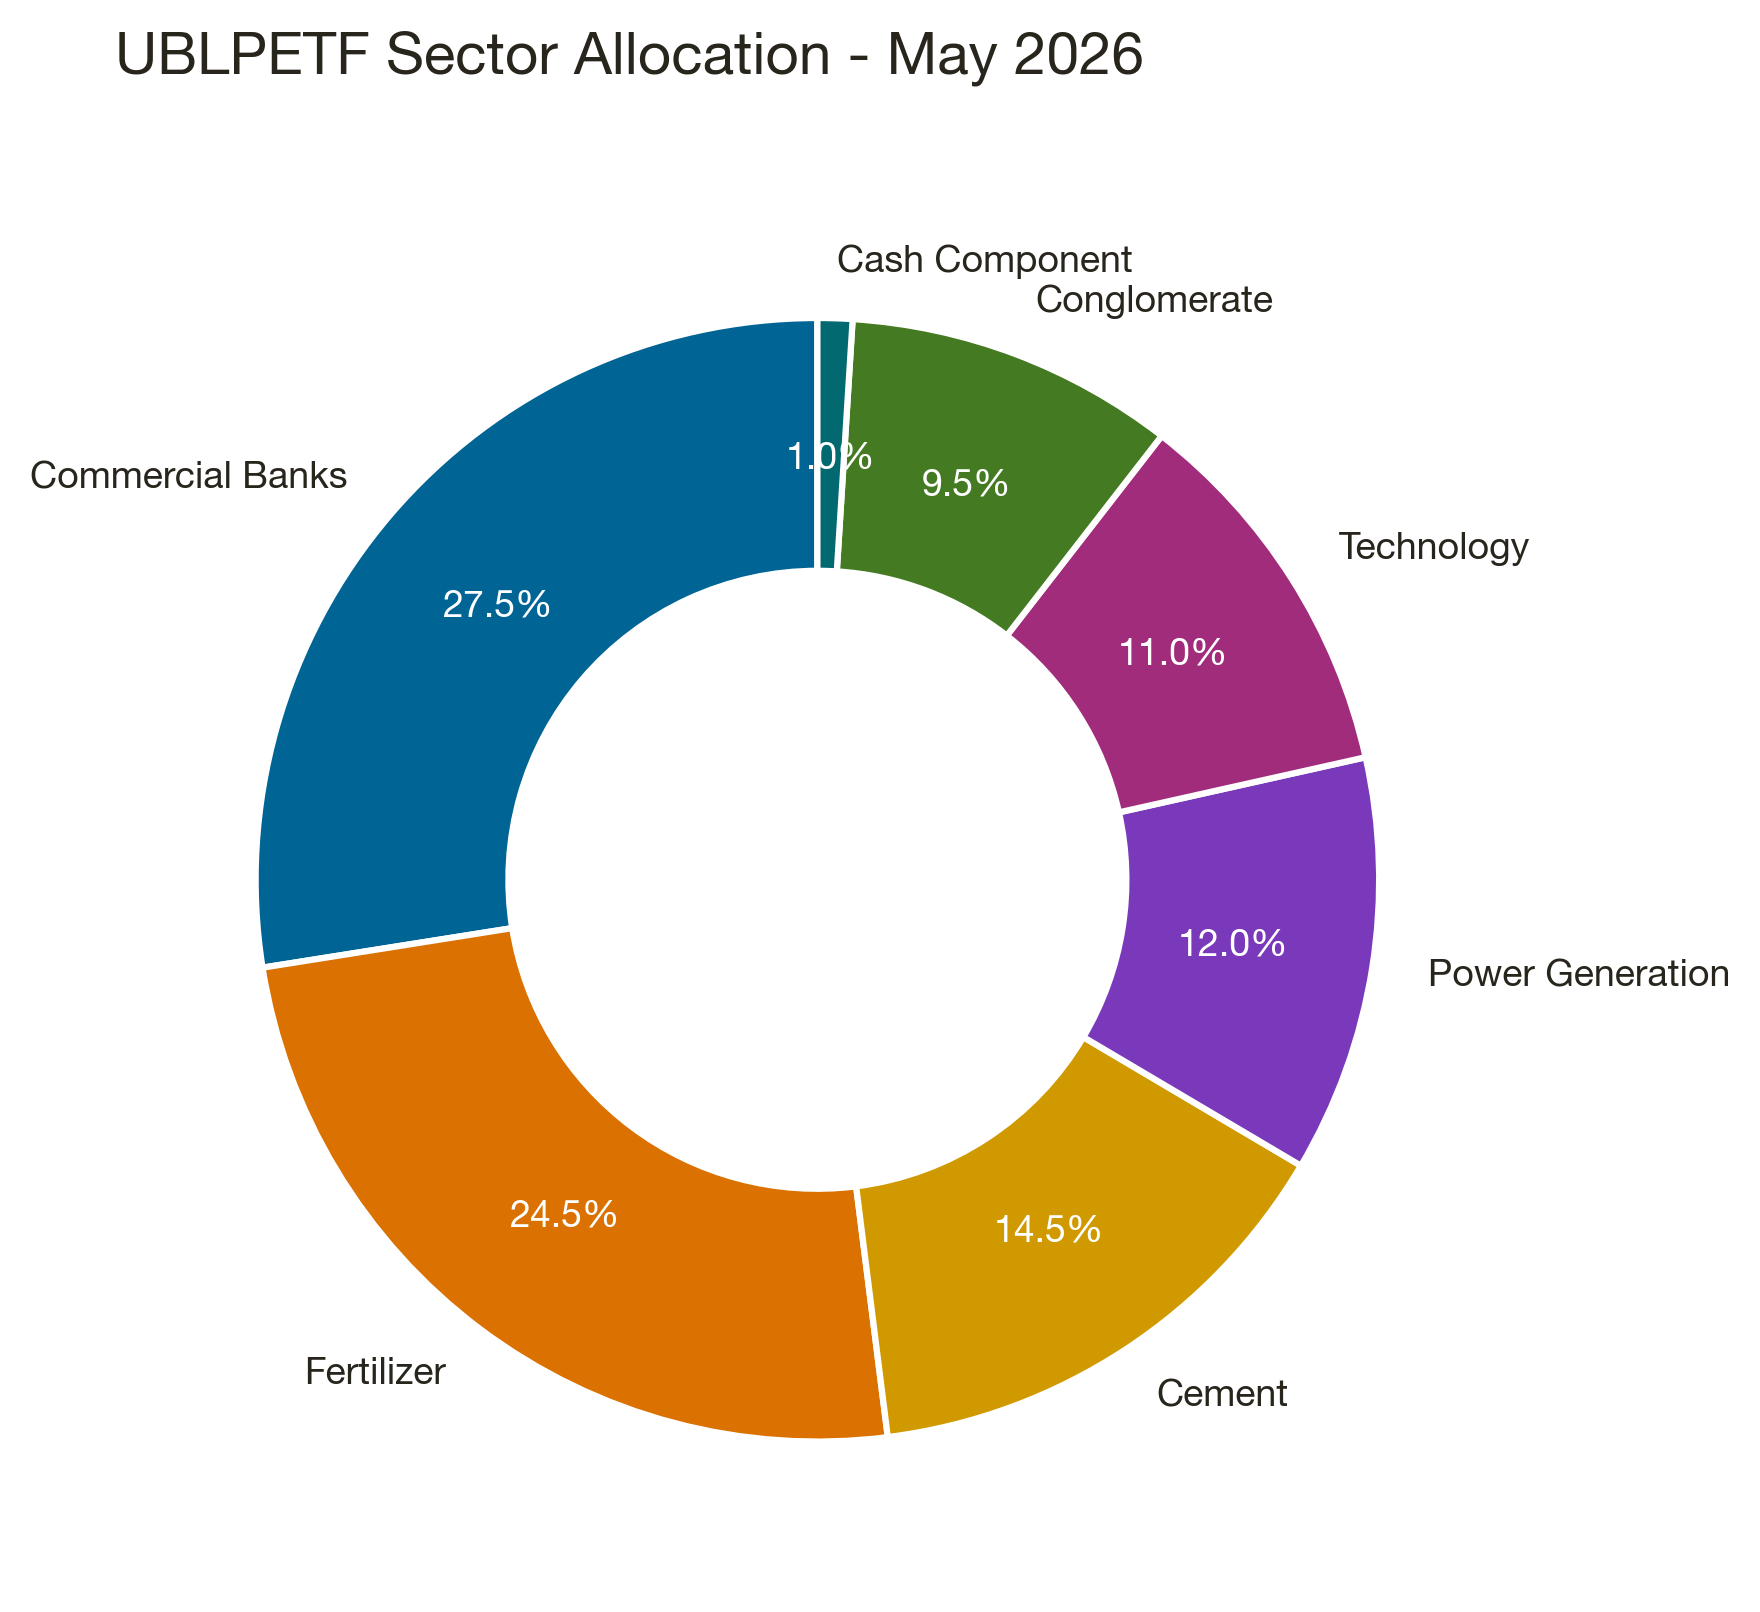
The sector exposure of UBLPETF highlights the complete exclusion of the Oil & Gas sector, creating a pure exposure to the industrial, consumer, and financial engines of Pakistan:
The Structural Ex-Oil Payoff: Why This Portfolio Differs
- No Hydrocarbon Volatility: Traditional PSX blue-chip funds carry huge weights in energy giants like OGDC, PPL, and MARI. These names are highly sensitive to global crude oil prices, energy circular debt, and government gas price adjustments. UBLPETF completely isolates you from this sector.
- Growth vs Value Balanced: The tech giant Systems Limited (SYS) at 22.73x P/E acts as the primary growth anchor, while HBL (5.50x P/E, 0.80x P/B) and ENGROH (4.98x P/E) offer deep value anchors trading at historic multiples.
- Dividend Giants: Engro Fertilizers (EFERT) and Fauji Fertilizer (FFC) provide exceptional cash flow generation, protecting the portfolio during stock market consolidation phases.
The Index Methodology: Rigorous Weight Management
UBLPETF's index methodology is one of the most transparent and disciplined on the PSX. Here is exactly how the weights work:
- Universe: All KSE-100 companies after removing O&G Exploration, O&G Marketing, and Refinery sub-sectors.
- Selection: Top 25 by free-float market cap AND top 25 by traded value (70% weight to recent year, 30% to preceding year). The final 9 stocks represent the intersection of these two lists.
- Weight Limits: Free-float market capitalization weighted, subject to:
- Minimum weight: 3.5% - no stock can be less than 3.5% of the portfolio.
- Maximum weight: 16.0% - no stock can exceed 16.0% of the portfolio.
- Quarterly Weight Rebalancing: Weights are reset every quarter on the last working day of April, July, October, and January.
- Semi-Annual Reconstitution: Stocks are officially added or removed every six months (May and November).
The 3.5%-16% band is a sophisticated design that prevents runaway concentration (no single stock can dominate) while ensuring every constituent maintains meaningful exposure (no diluted micro-positions).
UBLPETF Dividend History: Payouts & Yield Since Launch
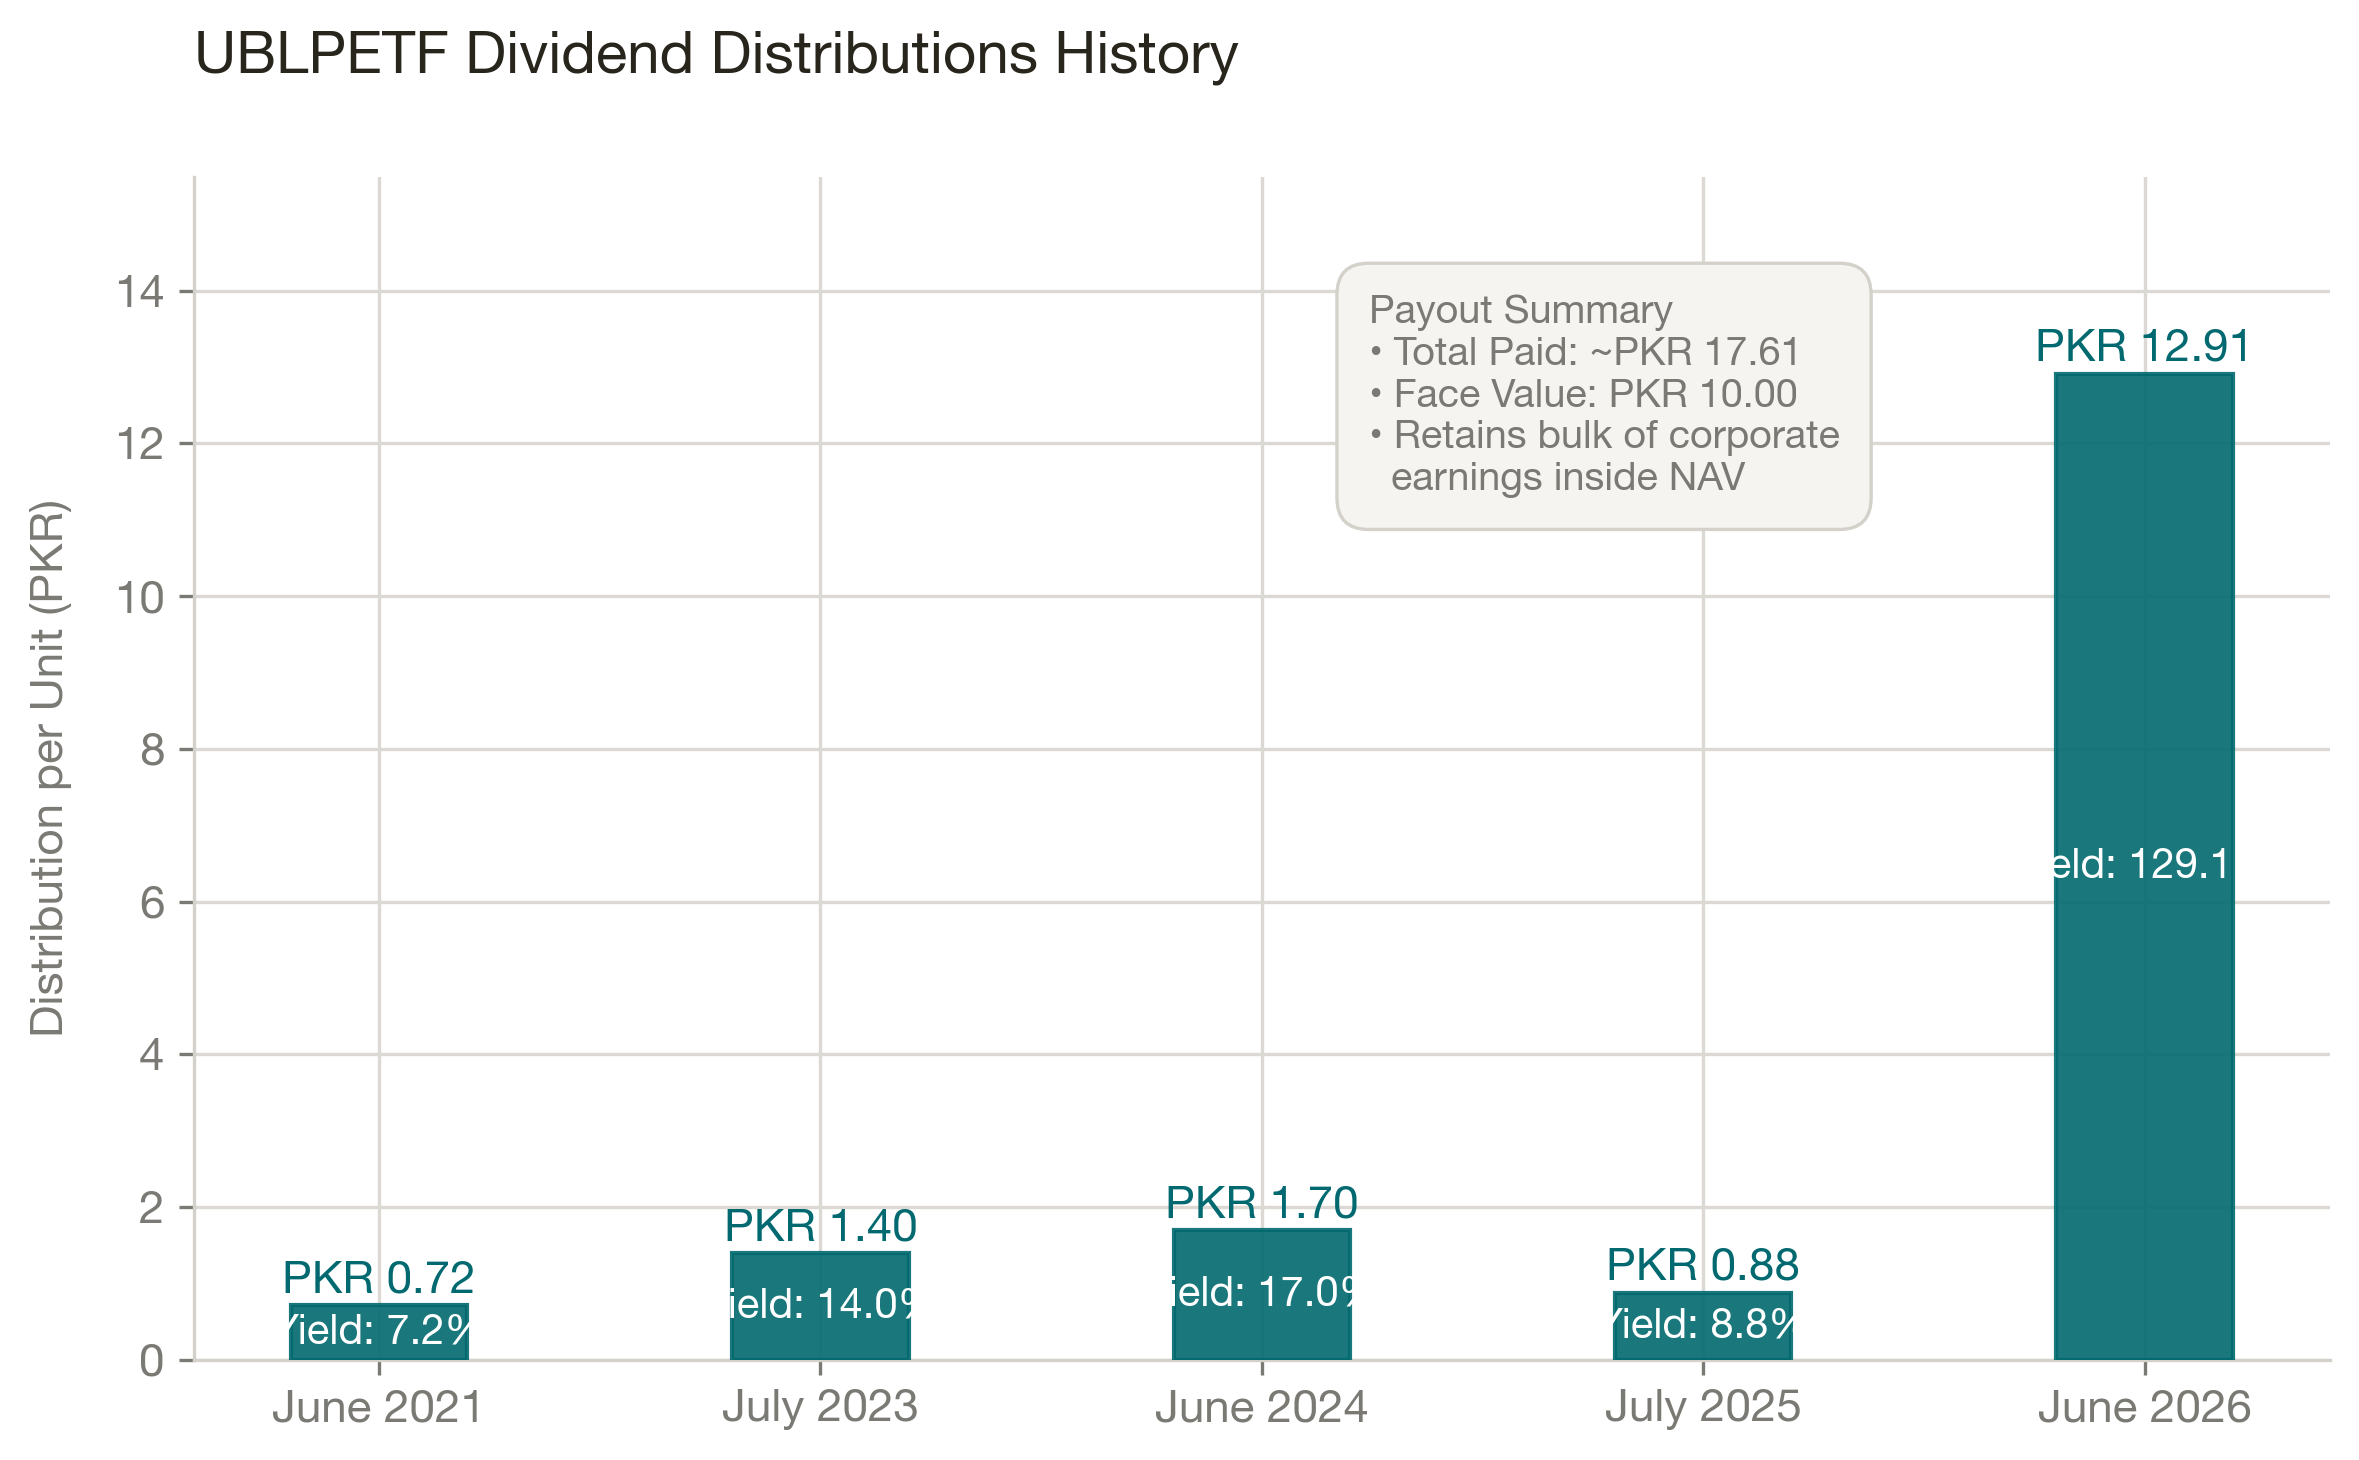
Many PSX investors prioritize dividend yields. UBLPETF pays periodic income distributions, though it maintains a conservative stance:
| Date | Type | Payout % of Face Value | PKR per Unit |
|---|---|---|---|
| June 2021 | Dividend | 7.20% | PKR 0.72 |
| July 2023 | Dividend | 14.00% | PKR 1.40 |
| June 2024 | Dividend | 17.00% | PKR 1.70 |
| July 2025 | Dividend | 8.78% | PKR 0.878 |
| June 2026 | Dividend | 129.11% | PKR 12.911 |
Payout data sourced from UBL Funds.
The June 2026 payout of PKR 12.911 per unit represents a massive trailing yield of approximately 42.0% on the current market price of PKR 30.75.
Unlike high-yielding sector funds like JSGBETF, UBLPETF retains the bulk of the corporate earnings it receives inside its Net Asset Value to drive capital appreciation. Investors should evaluate it as a capital-growth engine with occasional cash distributions, rather than a pure income play.
Notable Governance and Operational Flags
No review is complete without analyzing operational and governance history:
- Distribution Adjustments: In June 2024, UBLPETF's interim distribution announcement was revoked then revised the same day. In August 2021, an interim distribution was revoked outright. While these events did not cause long-term damage, they represent operational transparency flags.
- CEO Succession: UBL Fund Managers underwent a change of Chief Executive Officer in August 2024, which is always worth monitoring at the fund management level.
- Trading Suspensions: The fund implemented brief, temporary suspensions of creation and redemption in April and May 2025 to manage liquidity and market friction. Secondary market trading on the PSX remained unaffected.
Is UBLPETF Right for You?
UBLPETF is built on a specific investment thesis: Pakistan's blue-chip market, minus the energy sector. If you believe - as many institutional managers do - that OGDC, PPL, and PSO will underperform the broader market in a particular cycle, UBLPETF lets you act on that view through a single regulated instrument without shorting or underweighting individual stocks yourself. That deliberate O&G exclusion is either UBLPETF's strongest feature or its most significant blind spot, depending on how the energy cycle plays out.
What is hard to ignore is the 1.50% TER - the highest of the broad-market equity ETFs. NITGETF gives you similar large-cap coverage at 0.40% management fee. That 1.10% annual difference is real money over a decade. UBLPETF is transparent about its all-in costs, which is genuinely commendable, but transparency about cost doesn't make the cost smaller.
My recommendation: UBLPETF makes sense if you have a specific, well-reasoned view that O&G sector exposure will drag returns in the near-to-medium term and you want to position away from it systematically. It also suits investors who want formal weight bounds (no single stock above 16%) that prevent extreme concentration. If you do not have a clear view on the O&G sector, NBPGETF gives you broader coverage at lower cost, and NITGETF gives you even lower cost.
Final Verdict
UBLPETF is a thoughtfully designed niche product that fills a genuine gap in the Pakistani ETF market. No other fund gives you a single-ticker, rules-based, blue-chip Pakistan equity position with the entire O&G sector excluded.
The 44.40% one-year return, PKR 698.1 million AUM, and the 1.50% disclosed TER are all credible. The governance history (revoked distributions, a CEO change) adds minor flags but nothing that compromises the fund's structural integrity.
Our recommendations:
- For Investors With an O&G-Bearish View (Buy): This is your product. Concentrated exposure to Pakistan's banking, fertilizer, tech, and power sectors - without any hydrocarbon risk.
- For Portfolio Diversification (Buy as complement): Pair UBLPETF with JSGBETF (banking sector booster) for a portfolio that is overweight banking with zero O&G exposure - a specific and defensible strategy.
- For Cost-Focused Long-Term Investors (Compare first): The 1.50% TER is higher than NITGETF. If you do not have a specific reason to exclude O&G, NITGETF at 0.40% provides similar large-cap Pakistan exposure at lower cost.
Analyze This ETF
Frequently Asked Questions (FAQs)
What is UBLPETF?
UBLPETF is the UBL Pakistan Enterprise Exchange Traded Fund, listed on the Pakistan Stock Exchange. It tracks the UBL PSX Pakistan Enterprise Index - a proprietary index of 9 KSE-100 blue-chip companies, with the entire Oil & Gas sector excluded. It is managed by UBL Fund Managers.
Why does UBLPETF exclude Oil & Gas?
The fund's mandate is to provide exposure to Pakistan's "enterprise" economy - businesses driven by domestic consumption, services, and industrial production rather than commodity extraction. The O&G exclusion reflects the view that energy companies carry a different risk profile (global commodity prices, government gas pricing policy, extraction decline curves) versus banking, fertilizer, cement, and technology companies.
What is the minimum investment for UBLPETF?
The minimum subsequent investment is PKR 5,000 per the fund's offering document. On the PSX secondary market, you can buy a standard board lot (500 units minimum) for approximately PKR 19,240 at the current market price of PKR 38.48, excluding brokerage commissions and taxes.
What is UBLPETF's Total Expense Ratio?
The disclosed TER is 1.50% per annum. This is one of the few PSX ETFs that clearly discloses the all-in expense ratio. The base management fee is 0.75% per annum; the remaining 0.75% covers trustee fees, audit fees, SECP levies, and other fund expenses.
Is UBLPETF Shariah-compliant?
No. UBLPETF holds conventional commercial banks (HBL and UBL) and is not Shariah-screened. Investors seeking halal equity exposure should consider MIIETF.
How does UBLPETF handle weight limits?
The UBL PSX Pakistan Enterprise Index enforces a minimum weight of 3.5% and a maximum weight of 16.0% for each constituent. If a stock's market cap would push it above 16%, the excess is redistributed proportionally to the other constituents. If a stock falls below 3.5%, weight is transferred from stocks above 16% to bring it back up. This prevents any single stock from dominating the portfolio.
Can I buy UBLPETF through my regular broker?
You can buy or sell UBLPETF during normal trading hours on the Pakistan Stock Exchange through any registered PSX brokerage account. The minimum is one board lot of 500 units.
UBLPETF vs NITGETF: which is better?
UBLPETF excludes Oil & Gas stocks, while NITGETF includes them. If you are bullish on Pakistan's domestic economy (banks, cement, pharma) and want to reduce commodity exposure, UBLPETF provides a distinctive tilt. However, NITGETF has a significantly lower management fee (0.40% vs UBLPETF's ~0.75%). See our NITGETF review for a full comparison.
Who manages UBLPETF?
UBLPETF is managed by UBL Fund Managers, a wholly-owned subsidiary of United Bank Limited. The trustee is the Central Depository Company of Pakistan (CDC). The fund publishes monthly Fund Manager Reports (FMRs) and quarterly financial statements.
Further Reading
Before investing in UBLPETF, we recommend reviewing the following resources:
- Understanding ETF Fundamentals - Learn how a custom benchmark ETF like UBLPETF differs from a standard index ETF and what the "Ex-Oil & Gas" mandate actually means for your risk exposure.
- Pakistan ETF Expense Ratio Guide - Understand how UBLPETF's TER compares to its closest peers and how tracking error compounds the true cost of ownership.
- KSE-100 ETF Alternatives in Pakistan - A structured comparison of UBLPETF against NITGETF, NBPGETF, and other broad-market equity ETFs.
- ETF vs Mutual Fund in Pakistan - If you are deciding between UBLPETF and an actively managed consumer or blue-chip fund, this guide lays out the structural trade-offs clearly.
This article is for educational and informational purposes only. It does not constitute investment advice. Always conduct your own due diligence and consult a qualified financial advisor before making any investment decisions. All data sourced from PSX, MUFAP, and fund factsheets. Past performance is not indicative of future results.
Dr. Faisal Shahzad
Chief Investment Strategist
Dr. Faisal Shahzad holds an MBA from Innsbruck, Austria, and has spent over a decade navigating complex financial markets. He specializes in Exchange Traded Funds (ETFs) and brings extensive, practical knowledge of both international markets and the Pakistan Stock Exchange (PSX).
Expertise: 15+ Years of experience in ETFs, both internationally and on the PSX.
Explore UBLPETF With Our Free Tools
Go deeper on your analysis with institutional-grade analytics built specifically for PSX ETFs.